
10 Key Data Scientist Interview Questions for 2025
Walking into a data scientist interview can feel like stepping up to the plate in a high-stakes game. You know you have the skills, but the pressure is on to prove it when faced with questions that span from fundamental theories to complex, real-world scenarios. This guide is your playbook, meticulously breaking down the most common and crucial data scientist interview questions you're likely to face. We're not just giving you the questions, we are providing a complete game plan.
This listicle goes beyond simple definitions. For each item, you will find:
- Model answers that clearly explain the core concepts.
- Practical examples to illustrate your points effectively.
- Actionable tips on how to frame your responses to showcase your problem-solving mindset.
We've also included a special focus on the exciting field of sports analytics. If you're targeting a role with a team or a sports technology company, you'll find specific advice on how to tailor your answers to that industry. Understanding not just the 'what' but the 'why' and 'how' behind each question is what separates a good candidate from a great one. By the end of this article, you'll have the confidence and the knowledge to demonstrate your expertise and land the job you want. If you're ready to find that perfect role, check out current openings at www.sportsjobs.online to start your search. Let's dive in and prepare you for your next big interview.
1. Explain the bias-variance tradeoff
This is one of the most fundamental data scientist interview questions because it cuts to the heart of model performance and generalization. The bias-variance tradeoff describes the delicate balance between a model's systematic error (bias) and its sensitivity to the training data (variance). An effective answer demonstrates a deep, intuitive grasp of this concept, not just a textbook definition.
Bias is the error introduced by approximating a real-world problem, which may be complex, with a much simpler model. High-bias models make strong assumptions about the data, like linear regression assuming a linear relationship. This can lead to underfitting, where the model fails to capture the underlying patterns. Variance is the error from sensitivity to small fluctuations in the training set. A high-variance model pays too much attention to the training data, including its noise, leading to overfitting. This model performs exceptionally well on data it has seen but fails to generalize to new, unseen data.

Core Concepts and Examples
The goal is to find a model that is complex enough to capture the true signal in the data but not so complex that it models the noise.
- High Bias, Low Variance: Simple models like Linear Regression. They are stable and consistent but may oversimplify the problem, systematically missing the mark.
- Low Bias, High Variance: Complex models like unpruned Decision Trees or K-Nearest Neighbors with a small k. They can fit the training data almost perfectly but are highly volatile and change drastically with different training sets.
Sports Analytics Analogy: Imagine you're building a model to predict a basketball player's season-long three-point percentage.
- High Bias: A simple model that only uses the league's average percentage would be highly biased. It's stable but ignores the player's individual skill.
- High Variance: A model that over-analyzes a single hot-streak of five games would have high variance. It overfits to that specific, likely lucky, performance and won't accurately predict future shooting.
How to Discuss in an Interview
When asked this question, connect the theory to practical application. Discuss the techniques used to manage this tradeoff.
- Regularization: Techniques like Ridge (L2) and Lasso (L1) add a penalty term to the loss function to constrain the model's complexity, effectively reducing variance at the cost of a slight increase in bias.
- Cross-Validation: This method helps estimate a model's performance on unseen data by splitting the training set into multiple folds. It allows you to tune hyperparameters, like the complexity of a decision tree, to find the optimal balance.
Demonstrating you can apply these techniques in a real-world scenario, especially within the sports domain, will set you apart. If you're looking to apply these skills professionally, check out the latest sports analytics roles on www.sportsjobs.online.
2. How do you handle missing data?
This is a cornerstone of practical data scientist interview questions, as nearly every real-world dataset is incomplete. Your approach to handling missing data reveals your practical skills, attention to detail, and understanding of how data imperfections can impact model performance. A strong answer moves beyond simple deletion or mean imputation and discusses a thoughtful, context-aware strategy.
The first step is always to understand the nature of the missingness. Is it random, or is there a systematic reason? The mechanism of missingness, whether Missing Completely at Random (MCAR), Missing at Random (MAR), or Missing Not at Random (MNAR), dictates the most appropriate handling technique. Failing to correctly identify this can introduce significant bias into your analysis and models.

Core Concepts and Examples
Your chosen method should align with the data type, the percentage of missing values, and the underlying cause. There is no single best method, only the most appropriate one for the situation.
- Simple Imputation: Methods like mean, median, or mode imputation are fast but can distort the data's original distribution and variance. Median is often preferred over mean for skewed numerical data.
- Advanced Imputation: Techniques like K-Nearest Neighbors (KNN) imputation or Multiple Imputation by Chained Equations (MICE) are more sophisticated. They predict missing values based on other features, preserving relationships within the data more effectively.
- Domain-Specific Methods: For time-series data, methods like forward-fill or backward-fill are common. These assume the value is the same as the previous or next time step.
Sports Analytics Analogy: Imagine you're analyzing GPS tracking data from a soccer match, but some players' devices momentarily lost signal.
- Simple Deletion: Removing every player with any missing data point would be a poor choice, as you might lose valuable information from key players.
- Domain-Specific Imputation: A better approach would be to use interpolation or a forward-fill method, assuming the player's position and speed didn't change drastically in that microsecond of signal loss.
How to Discuss in an Interview
When answering, structure your response as a systematic process. Show that you don't just apply a method blindly but think critically about the consequences.
- Diagnose First: Start by explaining you would first analyze the patterns of missingness using visualization (e.g., missing value heatmaps) and statistical tests to hypothesize the reason.
- Explain Your Choice: Justify why you would select a specific method. For example, "I would use median imputation for player salary data because it's heavily skewed, and using the mean would be misleading."
- Consider the Impact: Mention creating an indicator variable (a binary column indicating if the original value was missing) as a new feature. This can sometimes capture hidden patterns and improve model performance.
Proving you can handle the messy reality of sports data is a huge plus for employers. If you're ready to put these data cleaning skills to the test, explore the exciting sports analytics jobs available on www.sportsjobs.online.
3. Explain overfitting and how to prevent it
This is another cornerstone of data scientist interview questions, closely related to the bias-variance tradeoff. Overfitting happens when a model learns the training data too well, memorizing not just the underlying patterns but also the noise and random fluctuations. The result is a model that performs exceptionally on the data it was trained on but fails miserably when introduced to new, unseen data, rendering it useless for real-world predictions.
An interviewer asks this to gauge your understanding of model generalization and your practical toolkit for building robust, reliable models. A strong answer moves beyond a simple definition and delves into the causes, detection methods, and prevention strategies, demonstrating hands-on experience in model validation and tuning. It shows you know how to create a model that is truly predictive, not just a good memorizer.
Core Concepts and Examples
The core issue of overfitting is a model that is too complex for the amount and quality of data available. It has high variance and low bias.
- High-Degree Polynomial Regression: Trying to fit a complex, curvy line (e.g., a 10th-degree polynomial) to a small set of data points that have a generally linear trend. The model will wiggle to hit every single point perfectly but will make wild predictions for any new point.
- Unpruned Decision Trees: A decision tree that is allowed to grow until every leaf is pure (contains samples from only one class). It creates hyper-specific rules that capture noise in the training set and don't generalize.
- Deep Neural Networks: A very deep network with millions of parameters trained on a small dataset can easily memorize the training examples without learning the underlying features.
Sports Analytics Analogy: Imagine you're building a model to predict a rookie quarterback's performance in his first season.
- Overfitting: Your model heavily weighs his single, record-breaking college game where he threw 7 touchdowns. The model learns this outlier as a key predictor and forecasts a historically great NFL season. When he faces tougher, professional defenses, the model's predictions are wildly inaccurate because it overfit to a noisy, non-representative event.
How to Discuss in an Interview
Your explanation should seamlessly transition from the "what" to the "how." Detail the practical techniques you would use to combat overfitting in a project.
- Simplify the Model: Use a less complex model architecture, for instance, fewer layers in a neural network, or a linear model instead of a high-degree polynomial.
- Use More Data: Often, the best defense against overfitting is a larger, more diverse training dataset. More data helps the model learn the true signal from the noise.
- Regularization: As with managing variance, techniques like L1 (Laso) and L2 (Ridge) add a penalty for complexity, shrinking coefficients and preventing the model from fitting the noise. Dropout is a common regularization technique for neural networks.
- Cross-Validation & Early Stopping: Use a robust validation strategy like k-fold cross-validation to get a reliable estimate of out-of-sample performance. During training, monitor the validation loss and stop training when it begins to increase, even if the training loss is still decreasing. This prevents the model from continuing to learn the noise in the training set.
Showcasing that you can identify and solve overfitting is crucial. If you're ready to apply these skills to solve real challenges in the sports world, find your next opportunity on www.sportsjobs.online.
4. What is the difference between supervised and unsupervised learning?
This is a cornerstone among data scientist interview questions, designed to confirm your understanding of the basic machine learning paradigms. Your answer reveals your foundational knowledge. Supervised learning involves training a model on a dataset where the "right answers" are given, meaning the data is labeled. Unsupervised learning, in contrast, involves finding hidden patterns and structures in data that has no predefined labels.
Answering this question well means going beyond simple definitions. You need to show you understand the practical implications of each approach. Supervised learning is like learning with a teacher, where you have examples of inputs and their corresponding correct outputs. Unsupervised learning is like being given a box of mixed puzzle pieces and being asked to find groups of similar pieces without seeing the final picture.
Core Concepts and Examples
The choice between these paradigms depends entirely on the data available and the business problem you need to solve. It’s crucial to demonstrate you can identify which approach fits a given scenario.
- Supervised Learning: The goal is prediction or classification. The model learns a mapping function from input variables (X) to an output variable (Y). Examples include email spam detection (classifying emails as spam or not) and house price prediction (predicting a continuous value).
- Unsupervised Learning: The goal is discovery. The model works on its own to discover information. Examples include customer segmentation (grouping customers by purchasing behavior) and anomaly detection (finding unusual data points that could signify fraud).
Sports Analytics Analogy: Consider predicting a soccer match outcome.
- Supervised: You would use a dataset of past matches that includes features like team form, shots on target, and possession, along with the final result (win, lose, draw). The labeled result is the "supervisor" that teaches the model.
- Unsupervised: You could use player-tracking data without any labels to cluster players into different playing styles (e.g., "box-to-box midfielder," "poacher," "playmaking defender") based on their movement patterns and on-field actions.
How to Discuss in an Interview
Elevate your answer by discussing the nuances and showing you think like a problem-solver. Briefly mention other learning types to showcase the breadth of your knowledge.
- Mention a spectrum: Acknowledge that the lines can blur. Mention semi-supervised learning (using a small amount of labeled data with a large amount of unlabeled data) and reinforcement learning (training an agent to make decisions through rewards and penalties).
- Connect to business value: Frame your examples in terms of business impact. For instance, unsupervised clustering can help a team's marketing department target specific fan segments with tailored promotions. Supervised models can help a front office predict a prospect's career trajectory to make better draft decisions.
Demonstrating this practical, problem-oriented thinking is exactly what hiring managers are looking for. If you're ready to apply these concepts in a professional setting, you can explore machine learning engineer roles in the sports industry on www.sportsjobs.online.
5. How do you evaluate model performance?
This is a critical data scientist interview question that separates candidates who only know how to run model.fit() from those who can deliver real business value. Your answer should reveal a nuanced understanding of various evaluation metrics and the importance of choosing the right one for the specific problem, especially considering factors like imbalanced data and business goals.
Evaluating a model goes beyond checking its accuracy. It involves a systematic process to ensure the model is not only correct but also useful and reliable. A great answer will cover metrics for classification and regression, the context in which to use them, and the validation strategy that ensures your performance estimates are trustworthy. It demonstrates that you can connect a model's statistical output to tangible business outcomes.
Core Concepts and Examples
The key is to match the metric to the business objective and the nature of the data. No single metric is universally best.
- Classification Metrics:
- Accuracy: Simple and intuitive, but misleading for imbalanced datasets.
- Precision & Recall: Crucial for problems where one type of error is more costly than another. Precision minimizes false positives, while recall minimizes false negatives.
- F1-Score: The harmonic mean of precision and recall, useful when you need a balance between the two.
- AUC-ROC: Measures a model's ability to distinguish between classes across all thresholds. It's great for balanced problems and for understanding overall model separability.
- Regression Metrics:
- Mean Absolute Error (MAE): Easy to interpret as it's in the same units as the target. It's less sensitive to large outliers.
- Root Mean Squared Error (RMSE): Also in the same units as the target, but it penalizes large errors more heavily due to the squaring term.
Sports Analytics Analogy: Imagine you're building a model to predict player injuries.
- High Recall is Key: You want to identify as many at-risk players as possible (minimize false negatives), even if it means you flag a few healthy players by mistake (lower precision). Missing a potential injury is far more costly than a false alarm.
- Accuracy would be misleading because most players are not injured in any given week. A naive model predicting "no injury" for everyone would have high accuracy but zero value.
How to Discuss in an Interview
Go beyond listing metrics. Explain the why and the how by connecting them to a validation framework and the ultimate business goal.
- Align with Business KPIs: Start by asking what the model is trying to achieve. Is it to reduce financial loss from fraud? Then precision is key. Is it to detect a rare disease? Recall is paramount.
- Discuss Validation Strategy: Mention the importance of a proper train-validation-test split to prevent data leakage and get an unbiased estimate of performance on unseen data. For smaller datasets, discuss k-fold cross-validation.
- Consider Context: Touch upon factors like interpretability and computational cost. Sometimes a slightly less accurate but more explainable model is better for stakeholder buy-in.
Demonstrating this deep, practical understanding is essential for landing a top role. If you are ready to apply these evaluation skills, you can find senior data scientist positions that require this expertise on platforms like www.sportsjobs.online.
6. Explain the Central Limit Theorem and its importance
This question probes your understanding of core statistical theory, which is the bedrock of many data science techniques. The Central Limit Theorem (CLT) is a pillar of statistical inference, and a strong answer shows you grasp not just the what, but the why it’s so critical for practical applications like hypothesis testing.
The CLT states that, given a sufficiently large sample size, the sampling distribution of the mean for a variable will approximate a normal distribution, regardless of that variable's distribution in the population. This is a powerful concept because it allows us to use normal probability theory to make inferences about population parameters, like the mean, even when we know nothing about the shape of the population's distribution. It's a key reason why the normal distribution, or bell curve, appears so frequently in statistics.

Core Concepts and Examples
The theorem's power lies in its ability to let us work with sample data to understand a larger population. We can treat the distribution of sample means as normal, which simplifies many statistical calculations.
- A/B Testing: When comparing two versions of a product, like a website layout, the CLT allows us to determine if a difference in conversion rates is statistically significant by assuming the distribution of sample means is normal.
- Confidence Intervals: The CLT is fundamental to calculating confidence intervals. It enables us to estimate a population mean with a certain level of confidence, for example, saying we are 95% confident the true mean lies within a specific range.
Sports Analytics Analogy: Imagine you want to estimate the average attendance for all minor league baseball games in a season. The distribution of attendance might be skewed, with many low-attendance games and a few sell-outs.
- Instead of collecting data for every single game, you take 100 random samples of 40 games each and calculate the average attendance for each sample.
- According to the CLT, the distribution of these 100 average attendance figures will be approximately normal. This allows you to calculate a reliable confidence interval for the true average attendance across the entire league.
How to Discuss in an Interview
When answering, focus on the practical utility of the theorem and its underlying assumptions. Show you understand when and why it can be applied.
- Assumptions: Mention the key assumptions, such as independence of samples, a sufficiently large sample size (often n > 30 is a rule of thumb), and that samples are drawn randomly from the population.
- Practicality: Connect the CLT directly to data science tasks. Explain how it enables hypothesis testing (like t-tests) and makes A/B testing a reliable tool for business decisions. It’s the bridge from sample data to population-level insights.
Demonstrating how you'd use the CLT to validate a test in a sports context, like assessing the impact of a new training regimen, shows you can translate theory into practice. If you are ready to apply these foundational skills, explore the latest sports analytics opportunities at www.sportsjobs.online.
7. What is regularization and why is it important?
This is a classic machine learning question that moves beyond theory and into practical model building. Regularization is a set of techniques used to prevent overfitting by adding a penalty term to the model's loss function. Answering this well shows that you understand how to build robust models that generalize effectively from training data to unseen data.
The core idea is to discourage overly complex models. By adding a penalty for large coefficient values, regularization forces the model to be more conservative. This effectively reduces the model's variance, often at the cost of a small increase in bias, striking a better balance in the bias-variance tradeoff. It’s a crucial tool for any data scientist aiming to deploy reliable predictive models.
Core Concepts and Examples
The two most common types of regularization are L1 (Lasso) and L2 (Ridge), each with a unique impact on the model's coefficients.
- L1 Regularization (Lasso): Adds a penalty equal to the absolute value of the magnitude of coefficients. This can shrink some coefficients to exactly zero, making it a powerful tool for automatic feature selection.
- L2 Regularization (Ridge): Adds a penalty equal to the square of the magnitude of coefficients. It shrinks coefficients towards zero but rarely makes them exactly zero. It's particularly useful for handling multicollinearity, where input features are highly correlated.
- Dropout (for Neural Networks): A different form of regularization where, during training, random neurons are "dropped out" or ignored. This prevents the network from becoming too reliant on any single neuron and encourages it to learn more robust features.
Sports Analytics Analogy: Imagine you're building a model to predict a soccer player's market value using hundreds of performance metrics.
- Lasso (L1): The model might discover that only a few key stats, like "goals scored," "assists," and "successful tackles," are truly important, shrinking the coefficients for all other less relevant stats to zero. This simplifies the model and makes it more interpretable.
- Ridge (L2): If stats like "sprints per game" and "distance covered" are highly correlated, Ridge would shrink both coefficients, preventing either one from having an outsized influence on the prediction.
How to Discuss in an Interview
Go beyond the definitions of L1 and L2. Discuss the practical implications and how you would choose and implement regularization.
- Hyperparameter Tuning: Explain that the strength of the regularization (lambda or alpha) is a hyperparameter that must be tuned, typically using cross-validation, to find the optimal setting for the specific problem.
- Feature Scaling: Mention that regularization is sensitive to the scale of the features. It is critical to standardize or normalize the data before applying regularized models to ensure the penalty is applied fairly across all features.
- Combining Methods: Acknowledge Elastic Net, which combines L1 and L2 penalties. This can offer a good middle ground, providing feature selection while also handling correlated predictors effectively.
Showing you can apply these nuanced techniques is essential. If you’re ready to put this knowledge to the test in a professional setting, explore the exciting sports analytics jobs available on www.sportsjobs.online.
8. How do you handle imbalanced datasets?
This is one of the most practical data scientist interview questions you'll encounter, as imbalanced data is the norm, not the exception, in many real-world applications. An imbalanced dataset is one where the classes are not represented equally. A model trained on such data will often achieve high accuracy by simply predicting the majority class, making it useless for identifying the minority class, which is often the event of interest.
The key to a strong answer is demonstrating a multi-faceted strategy. You need to show you understand that there is no single "best" solution and that the right approach depends on the problem, the data, and the business context. Simply saying "I'll use SMOTE" isn't enough, you must articulate the why behind your choices and the potential trade-offs involved.
Core Concepts and Examples
Your goal is to train a model that learns the characteristics of the minority class without being overwhelmed by the majority class. This often requires a combination of data-level and algorithm-level techniques.
- Data-Level Techniques: These methods modify the training data to create a more balanced distribution.
- Undersampling: Randomly removing instances from the majority class. This is fast but can lead to information loss.
- Oversampling: Randomly duplicating instances from the minority class. This can lead to overfitting as the model sees the same data points multiple times.
- Synthetic Data Generation (SMOTE): The Synthetic Minority Over-sampling Technique creates new, artificial minority class instances by interpolating between existing ones, reducing the risk of overfitting compared to simple oversampling.
- Algorithm-Level Techniques: These methods modify the learning algorithm itself to be more sensitive to the minority class.
- Cost-Sensitive Learning: Assigning a higher misclassification cost to the minority class, forcing the model to pay more attention to it during training.
- Ensemble Methods: Techniques like Balanced Random Forest or EasyEnsemble build multiple models on balanced subsets of the data and combine their predictions.
Sports Analytics Analogy: Imagine you're building a model to predict season-ending injuries for professional athletes, a relatively rare event.
- Imbalanced Model: A naive model might predict "no injury" for every player and achieve 98% accuracy, but it would be completely useless for the team's medical staff.
- Balanced Approach: You could use SMOTE to create synthetic examples of injured players based on their workload and biomechanics. You would also change your evaluation metric from accuracy to F1-score or Precision-Recall AUC, as these are more informative for imbalanced problems.
How to Discuss in an Interview
Structure your answer as a step-by-step process. First, emphasize understanding the business problem. What is the cost of a false positive versus a false negative?
- Start with Metrics: Explain that accuracy is a misleading metric here. You would focus on metrics like Precision, Recall, F1-Score, and the Area Under the Precision-Recall Curve (AUPRC).
- Discuss Techniques: Mention a range of techniques, from simple undersampling to more advanced methods like SMOTE or cost-sensitive learning. Show you know the pros and cons of each.
- Validate Correctly: Stress the importance of proper validation. You should perform resampling techniques only on the training set. The test set must remain in its original, imbalanced distribution to provide a true estimate of real-world performance.
Demonstrating this thoughtful, structured approach will show you can tackle one of the most common and critical challenges in applied data science. If you want to apply these skills to solve real problems in the sports world, check out the data scientist roles available on www.sportsjobs.online.
9. Walk me through a project you've worked on
This is one of the most crucial behavioral data scientist interview questions. It’s an open invitation to showcase your end-to-end skills, from problem framing and data handling to modeling and communicating business impact. A strong answer moves beyond a simple description and tells a compelling story about how you solve real-world problems.
Your response reveals your entire workflow, technical depth, problem-solving approach, and communication abilities. Interviewers use it to gauge how you translate a vague business need into a concrete, data-driven solution. They want to see your thought process, the challenges you faced, and how you measured success.
Core Concepts and Examples
The key is to structure your story logically, highlighting your specific contributions and the value you generated. A well-chosen project demonstrates a clear outcome.
- Customer Churn Prediction: A project where you identified key drivers of customer churn and built a model that led to a 15% reduction in churn rate through targeted retention campaigns.
- Recommendation System: Developing a content or product recommendation engine that increased user engagement by 25% by personalizing the user experience.
- Demand Forecasting: Creating a time-series model for a sports retailer that improved inventory management and reduced stockouts, leading to better operational efficiency.
Sports Analytics Analogy: Imagine you're asked to describe a project predicting player injuries for a football team.
- Situation: The team was losing key players to preventable soft-tissue injuries, impacting game outcomes.
- Task: Your task was to build a predictive model using player tracking data (GPS), historical injury reports, and workload metrics to identify at-risk players.
- Action: You cleaned and integrated disparate data sources, engineered features like acute-to-chronic workload ratio, and trained a gradient boosting model. You collaborated with the medical staff to validate the model's outputs.
- Result: The model identified high-risk players with 75% accuracy, allowing trainers to implement personalized recovery protocols that led to a 20% reduction in soft-tissue injuries for the season.
How to Discuss in an Interview
Structure is everything. Use the STAR method (Situation, Task, Action, Result) as your framework to ensure a clear, concise, and impactful narrative.
- Be Specific About Your Role: Clearly state what you did. Did you own the entire project, or were you responsible for feature engineering and modeling? Avoid using "we" too often.
- Quantify Your Impact: Don’t just say the project was successful. Use metrics. How much money was saved? By what percentage did a KPI improve? This demonstrates your business acumen.
- Anticipate a Deep-Dive: Be prepared for follow-up questions about your technical choices. Why did you choose that algorithm? How did you handle missing data? What other approaches did you consider?
Effectively communicating a project's narrative is a skill that sports organizations highly value. If you're ready to apply this skill, browse the latest openings on www.sportsjobs.online.
10. Explain the difference between bagging and boosting
This is a classic ensemble learning question and a staple in data scientist interview questions. It tests your understanding of how to combine multiple models to create a more powerful and robust one. A strong answer moves beyond definitions to explain the core mechanisms, the impact on bias and variance, and when to use each technique.
Bagging, short for Bootstrap Aggregating, is an ensemble method that aims to reduce variance. It works by training multiple models (e.g., decision trees) independently and in parallel on different random subsets of the training data, sampled with replacement. The final prediction is made by averaging the outputs (for regression) or taking a majority vote (for classification).
Boosting, in contrast, is a sequential process designed to reduce bias. It builds models one after another, where each new model focuses on correcting the errors made by its predecessors. It gives more weight to the data points that were previously misclassified, allowing the ensemble to learn from its mistakes and improve its overall accuracy.
This infographic breaks down the core distinctions between these two powerful ensemble techniques.
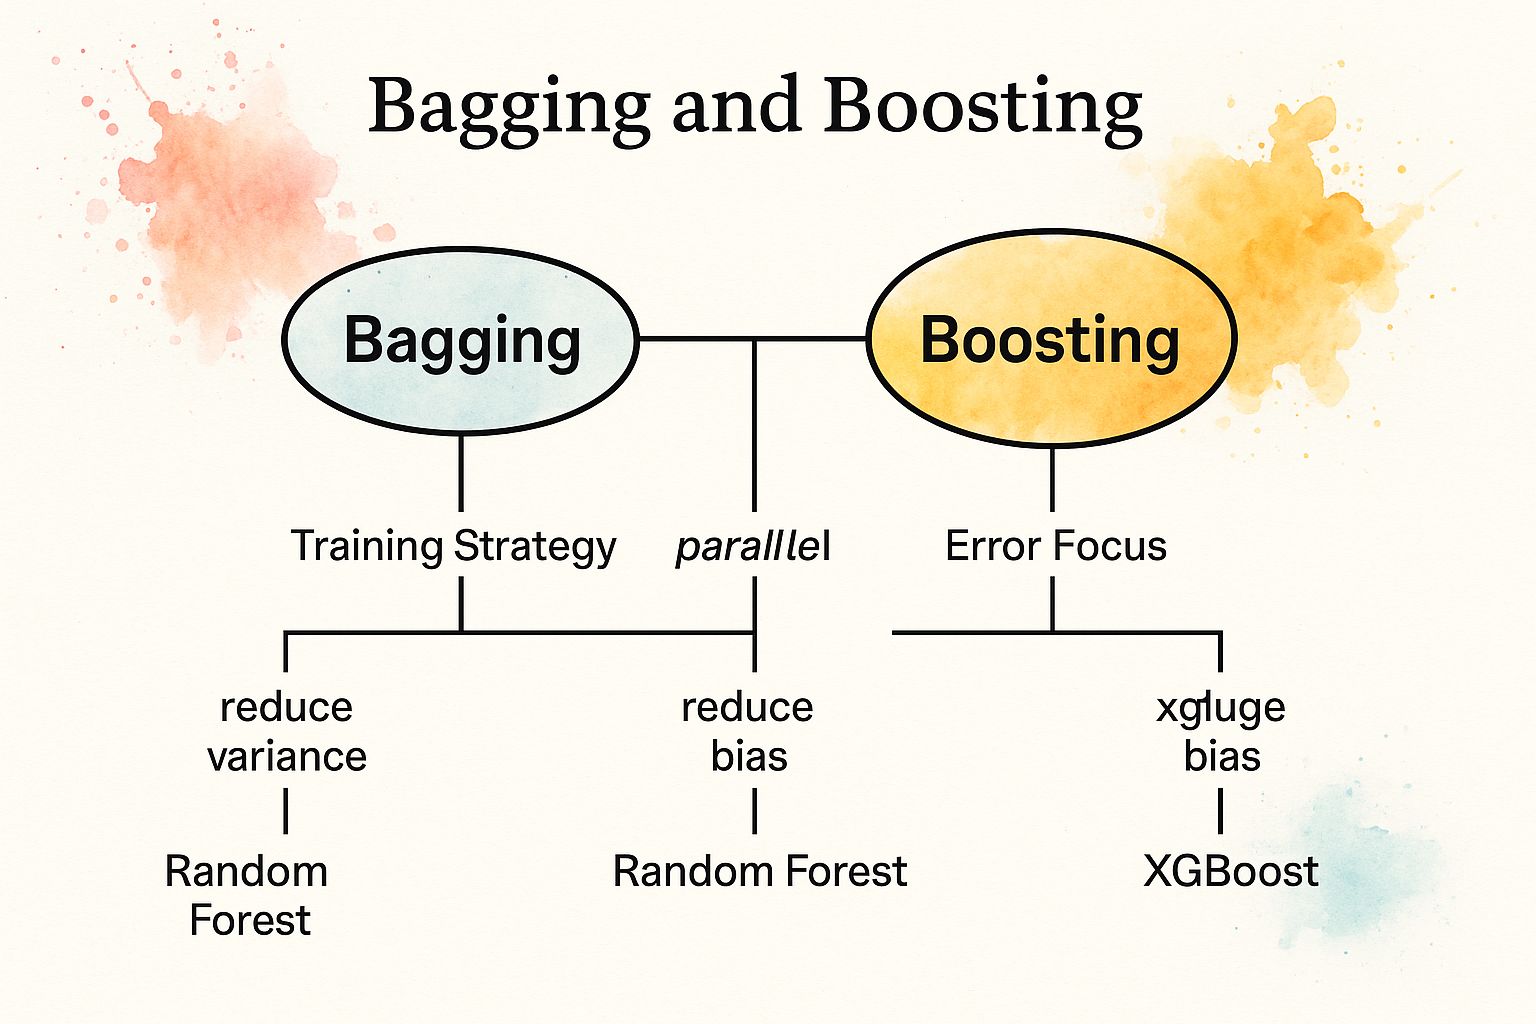
The visualization highlights how the fundamental difference in training strategy, parallel versus sequential, directly influences whether the primary goal is reducing variance or bias.
Core Concepts and Examples
The choice between bagging and boosting depends entirely on the problem and the characteristics of your base models.
- Bagging (Reduces Variance): Best for complex models that are prone to overfitting (high variance). By averaging many uncorrelated models, it smooths out their predictions. The most famous example is the Random Forest algorithm.
- Boosting (Reduces Bias): Best for simple models that are prone to underfitting (high bias). It sequentially combines these "weak learners" into a single strong learner. Popular examples include AdaBoost, Gradient Boosting Machines (GBM), and XGBoost.
Sports Analytics Analogy: Imagine you're trying to predict which team will win a soccer match.
- Bagging: You could ask 100 different soccer analysts to make a prediction independently based on slightly different sets of historical game data. You then take the majority vote. This approach reduces the risk of one analyst's quirky, overfitted model skewing the result.
- Boosting: You ask a junior analyst for a prediction. You then ask a second, more senior analyst to focus specifically on the games the first analyst got wrong. A third expert then focuses on the mistakes made by the first two combined. This sequential process builds a highly accurate, specialized prediction.
How to Discuss in an Interview
In an interview, articulate the trade-offs. Explain that bagging is about creating a "democracy of models," while boosting is like building a "team of specialists."
- Discuss how bagging helps create a robust model that generalizes well and is less sensitive to noise in the training data.
- Explain that boosting can achieve very high accuracy but is more sensitive to noisy data and outliers, and can be prone to overfitting if not carefully tuned.
- Mention that boosting models are often harder to tune, with more hyperparameters (like learning rate and n_estimators) to manage compared to a Random Forest.
Showing you can apply these powerful ensemble methods is key for landing a top role. If you want to use these skills in a fast-paced environment, check out the data science positions on www.sportsjobs.online.
Key Data Scientist Interview Questions Comparison
| Topic | Implementation Complexity 🔄 | Resource Requirements ⚡ | Expected Outcomes 📊 | Ideal Use Cases 💡 | Key Advantages ⭐ |
|---|---|---|---|---|---|
| Explain the bias-variance tradeoff | Medium: conceptual understanding needed | Low to medium: mainly theoretical | Clear grasp of model complexity and generalization | Model selection, understanding ML fundamentals | Fundamental ML principle, guides model tuning |
| How do you handle missing data? | Medium: requires choosing right methods | Medium to high: depends on data size | Improved data quality, more reliable models | Data preprocessing, incomplete datasets | Practical, enhances data integrity |
| Explain overfitting and how to prevent it | Medium: understanding plus techniques | Medium: requires validation processes | Better generalization, avoids poor test performance | Model training, deployment | Ensures robust models, reduces variance |
| What is the difference between supervised and unsupervised learning? | Low: basic conceptual knowledge | Low: no heavy resource needs | Understanding of learning paradigms | Choosing ML approaches, algorithm selection | Fundamental ML knowledge, versatile |
| How do you evaluate model performance? | Medium: varied metrics and validation | Medium: depends on evaluation methods | Reliable performance assessment | Model validation, business-aligned evaluation | Ensures appropriate model assessment |
| Explain the Central Limit Theorem and its importance | Medium: statistical theory | Low: conceptual and analytical | Foundation for statistical inference | Hypothesis testing, confidence intervals | Key statistical foundation, broadly applicable |
| What is regularization and why is it important? | Medium: requires knowledge of techniques | Medium: tuning hyperparameters | Controls model complexity, improves generalization | Preventing overfitting, feature selection | Enhances model robustness, reduces overfitting |
| How do you handle imbalanced datasets? | Medium to high: multiple techniques | Medium to high: may need advanced methods | Balanced models, improved minority class prediction | Fraud detection, rare event modeling | Practical problem-solving in real-world data |
| Walk me through a project you've worked on | Variable: depends on project complexity | Variable: depends on project scale | Demonstrates skills, problem solving, impact | Behavioral interviews, storytelling | Shows communication & technical depth |
| Explain the difference between bagging and boosting | High: advanced ensemble learning concepts | Medium to high: depends on algorithms | Understanding of advanced ensemble strategies | Improving prediction accuracy, competitions | Strong ensemble understanding, bias-variance insights |
Your Next Move: From Preparation to Landing the Job
Navigating the landscape of data scientist interview questions can feel like a high-stakes game. You have explored the fundamental concepts, from the delicate balance of the bias-variance tradeoff to the practical strategies for handling missing data and preventing overfitting. We have delved into the core principles of machine learning, distinguishing between supervised and unsupervised approaches, and outlined the critical techniques of model evaluation, regularization, and managing imbalanced datasets. But memorizing definitions is just the entry ticket.
The true goal is to demonstrate a deep, intuitive understanding that connects these technical pillars to real-world problem-solving. An interviewer isn't just testing your knowledge of bagging versus boosting, they are trying to envision you as a colleague. They want to see how you think, how you communicate complex ideas, and how you translate a technical challenge into a strategic advantage for the business, or in the context of sports, for the team.
From Theory to Storytelling
Your most powerful tool in any interview is your ability to tell a compelling story. The "walk me through a project" question is not just another item on the list, it's the centerpiece of your interview performance. This is your stage to weave together the concepts we have discussed into a coherent narrative.
Consider how you can reframe your project experiences through the lens of these questions:
- Project Kickoff: When you started your project, how did you handle the initial data exploration? Did you encounter missing data? What imputation strategies did you consider, and why did you choose a specific one? This shows proactive data cleaning and critical thinking.
- Model Development: As you built your model, how did you manage the bias-variance tradeoff? Did you start with a simpler model to establish a baseline before moving to a more complex one? Explain that thought process. This demonstrates a methodical and strategic approach.
- Performance Tuning: How did you prevent overfitting? Discuss the specific regularization techniques (like L1 or L2) you implemented and why they were appropriate for your model and data. Mention cross-validation as your method for robust evaluation.
- Evaluation and Impact: How did you evaluate your model's performance? Move beyond just "accuracy." Did you use an F1-score because of an imbalanced dataset? Did you use Mean Absolute Error because of the business context? Connect your choice of metric directly to the project's goals.
By structuring your project narrative this way, you are not just answering one question. You are proactively demonstrating your command over at least five or six core data science competencies. You are showing, not just telling, them that you are a capable, thoughtful data scientist.
The Sports Analytics Edge
For those targeting the exhilarating world of sports analytics, this narrative approach is even more critical. The stakes are wins and losses, player health, and fan engagement. Your ability to explain how a model that predicts player fatigue (and how you handled the imbalanced data of "fatigued" vs. "not fatigued" players) can directly influence coaching decisions is what will set you apart. If you are passionate about a career in this dynamic field, finding the right opening is your next crucial step. To discover roles with professional teams and cutting-edge sports technology firms, you can explore specialized platforms like www.sportsjobs.online to find your perfect match.
Your Action Plan for Success
Mastering these data scientist interview questions is a journey of continuous improvement, not a one-time cram session. Here is your actionable plan to move forward:
- Create a "Question-Project Map": Take your top two or three projects and map each of the questions in this article to a specific aspect of that project. Write down the connection.
- Practice Articulation: Record yourself explaining these concepts out loud. Use a whiteboard or a piece of paper to sketch out diagrams as if you were in the interview room. Does your explanation of the Central Limit Theorem sound confident and clear?
- Conduct Mock Interviews: Partner with a peer, a mentor, or use an online platform to simulate the interview experience. Ask for honest feedback on your communication style, clarity, and the depth of your answers.
The confidence you seek comes from preparation. It comes from knowing your material so well that you can stop focusing on reciting the "right" answer and start engaging in a genuine, intelligent conversation. You have the knowledge and the roadmap. Now, it is time to put in the reps, refine your narrative, and step into your next interview not as a candidate, but as a future colleague ready to make an impact.
Ready to put your preparation to the test and find your next challenge? Your dream role in sports analytics is closer than you think. Find exclusive job openings with top teams and sports tech companies on Sportsjobs Online, the premier destination for careers in the sports industry.
Find Your Data Scientist Role in Sports at Sportsjobs Online
Hundreds of jobs are waiting for you!
Subscribe to membership and unlock all jobs
Sports Analytics
We scan all major sports and leagues
Updated Daily
New jobs are added every day as companies post them
Refined Search
Use filters like skill, location, etc to narrow results
Alerts
You can get daily alerts in your email for a specific search
Monthly
$6.99
per month
✓ Flexible monthly billing
✓ Unlimited access to all jobs
✓ Advanced filtering tools
✓ Exclusive discount codes
✓ Cancel anytime
BEST VALUE
Yearly
$39
per year • Only $3.25/mo
✓ Save 50% vs monthly
✓ Unlimited access to all jobs
✓ Advanced filtering tools
✓ Exclusive discount codes
✓ Cancel anytime
Lifetime
$59
one-time • forever
✓ Pay once, access forever
✓ Unlimited access to all jobs
✓ Advanced filtering tools
✓ Exclusive discount codes
✓ Best long-term value