
A Practical Data Modeling Tutorial for Sports Analytics
This whole data modeling thing can feel a bit abstract, but let me break it down into something you can actually use. My goal here is to give you a real, practical framework for taking a mountain of raw sports data and turning it into an asset that gives your team a serious edge. It’s all about making sure your stats are rock-solid and your insights are sharp.
Why Data Modeling Is Your MVP in Sports Analytics

Before you even think about writing a single line of code, you need to get one thing straight: data modeling is your most valuable play. Seriously. This isn't just about drawing some technical diagrams for the IT department; it's about creating the strategic playbook for your entire analytics operation.
Think of a strong data model as the foundation of your house. With a good one, you can trust every single stat you report and have confidence in the insights you generate. It's what lets you dig in and answer the complex questions that actually drive decisions on and off the field.
From a Mess of Data to Game-Winning Insights
Let's be honest, without a proper model, you're just hoarding numbers. A good model is what helps you organize that data into a story that matters. It’s how you start asking, and answering, the really interesting questions:
- Which of our players are clutch in high-pressure, late-game situations?
- What are our most effective offensive plays when we're up against a specific defensive formation?
- How does a player's fatigue actually correlate with their performance over a long season?
Putting in the work upfront on a solid model saves you from the nightmare of data integrity issues and hours of frustrating cleanup down the road. It’s the difference between a championship team with a clear strategy and a bunch of talented players running around without a unified plan. If you're passionate about building these kinds of winning strategies, you can find some pretty exciting gigs in the industry over at www.sportsjobs.online.
A well-structured data model is your single source of truth. It guarantees that when you ask the same question twice, you get the same answer, building confidence across the organization.
And the demand for people who can do this? It's exploding. The global market for data modeling tools was sitting at around USD 1.2 billion in 2023. Projections show it more than doubling to about USD 2.8 billion by 2032. That tells you just how critical this skill has become. You can dig into the full research on the data modeling tool market to see the trends for yourself.
Bottom line: getting good at this gives you a massive edge in the sports analytics world.
Defining Your Sports Data Blueprint

Alright, this is where we roll up our sleeves and move from theory to actual practice. You can't build a solid house without a good blueprint, and the same goes for a data model. It all starts with asking the right questions to figure out exactly what we need our system to do.
For this guide, let's ground ourselves in a real-world scenario: building a model to track player performance and team stats for a basketball league. The end goal is to create a data structure that lets us easily pull insights about players, teams, and how they perform in actual games.
Honestly, getting this initial planning phase right is the most critical part of the entire process. A well-thought-out blueprint makes everything that follows, from creating diagrams to writing the final SQL code, infinitely smoother.
Identifying Your Core Entities
First things first, we need to pinpoint our core entities. Just think of these as the main "nouns" in our data story. They are the fundamental subjects we need to collect information about.
In our basketball analytics example, the obvious entities that jump out are:
- Players: The individual athletes competing on the court.
- Teams: The organizations that the players belong to.
- Games: The specific matchups where teams face off.
- Stats: The individual performance metrics we want to capture.
Once you have this list, you've laid the foundation. Now we can start adding the details.
Defining Attributes and Relationships
With our entities locked in, the next step is to give them attributes. These are just the specific details or characteristics we need to store for each entity. For a 'Player', this would include things like their first name, last name, jersey number, and position. Simple enough.
At the same time, we have to think about the relationships between these entities. How do they all connect and interact?
A relationship simply defines how two or more entities are linked. For instance, a 'Player' is on one 'Team' and plays in many 'Games'. These connections are the essential glue that holds the entire database together and makes it functional.
This table breaks down our core entities and the kinds of attributes we might want to track for each one.
Core Entities and Their Attributes
| Entity | Example Attributes | Role in the Analytics Model |
|---|---|---|
| Players | PlayerID, FirstName, LastName, Position, Height | The central subject of performance analysis. |
| Teams | TeamID, TeamName, City, Coach | Provides context for player performance and enables team-level stats. |
| Games | GameID, Date, Venue, HomeTeamID, AwayTeamID | The event where all performance data is generated. |
| Stats | StatID, GameID, PlayerID, Points, Rebounds, Assists | Captures the specific performance metrics for each player in a game. |
Thinking through these connections carefully at the start is what separates a robust model from one that causes endless headaches down the road.
This kind of foundational data preparation work is becoming more and more valuable. The global data preparation market was valued at USD 6.50 billion in 2024 and is on track to hit a massive USD 27.28 billion by 2033. You can dig into the specifics by checking out the full report on data preparation trends.
This growth highlights just how critical this skill set is. Professionals who can master this stage, like a Director of Business Insights & Analytics, are incredibly sought-after in the sports world.
Putting in the effort here ensures your data model is flexible and powerful enough to give your organization the competitive edge it's looking for.
Visualizing the Game Plan with ER Diagrams
Okay, we’ve got our requirements hammered out. Now it's time to take those abstract ideas and give them a visual structure. This is where an Entity-Relationship Diagram (ERD) becomes your best friend.
Think of an ERD as the architectural blueprint for your database. It’s a flowchart that clearly lays out how all your different pieces, your entities, like 'Players' and 'Teams', are connected.
Drawing this out isn't just a box-ticking exercise. It makes your data structure tangible, something you and your team can actually point to and discuss. By sketching it out, you can catch potential design flaws, awkward relationships, or missing pieces long before you write a single line of SQL. It's a critical step that separates a robust model from one that will cause headaches down the road.
From Conceptual to Logical Design
Building a data model is a process of refinement. You don't jump straight into the nitty-gritty details. Instead, you start high-level and gradually add layers of complexity.
This is the typical flow, moving from a rough concept to a solid implementation plan.
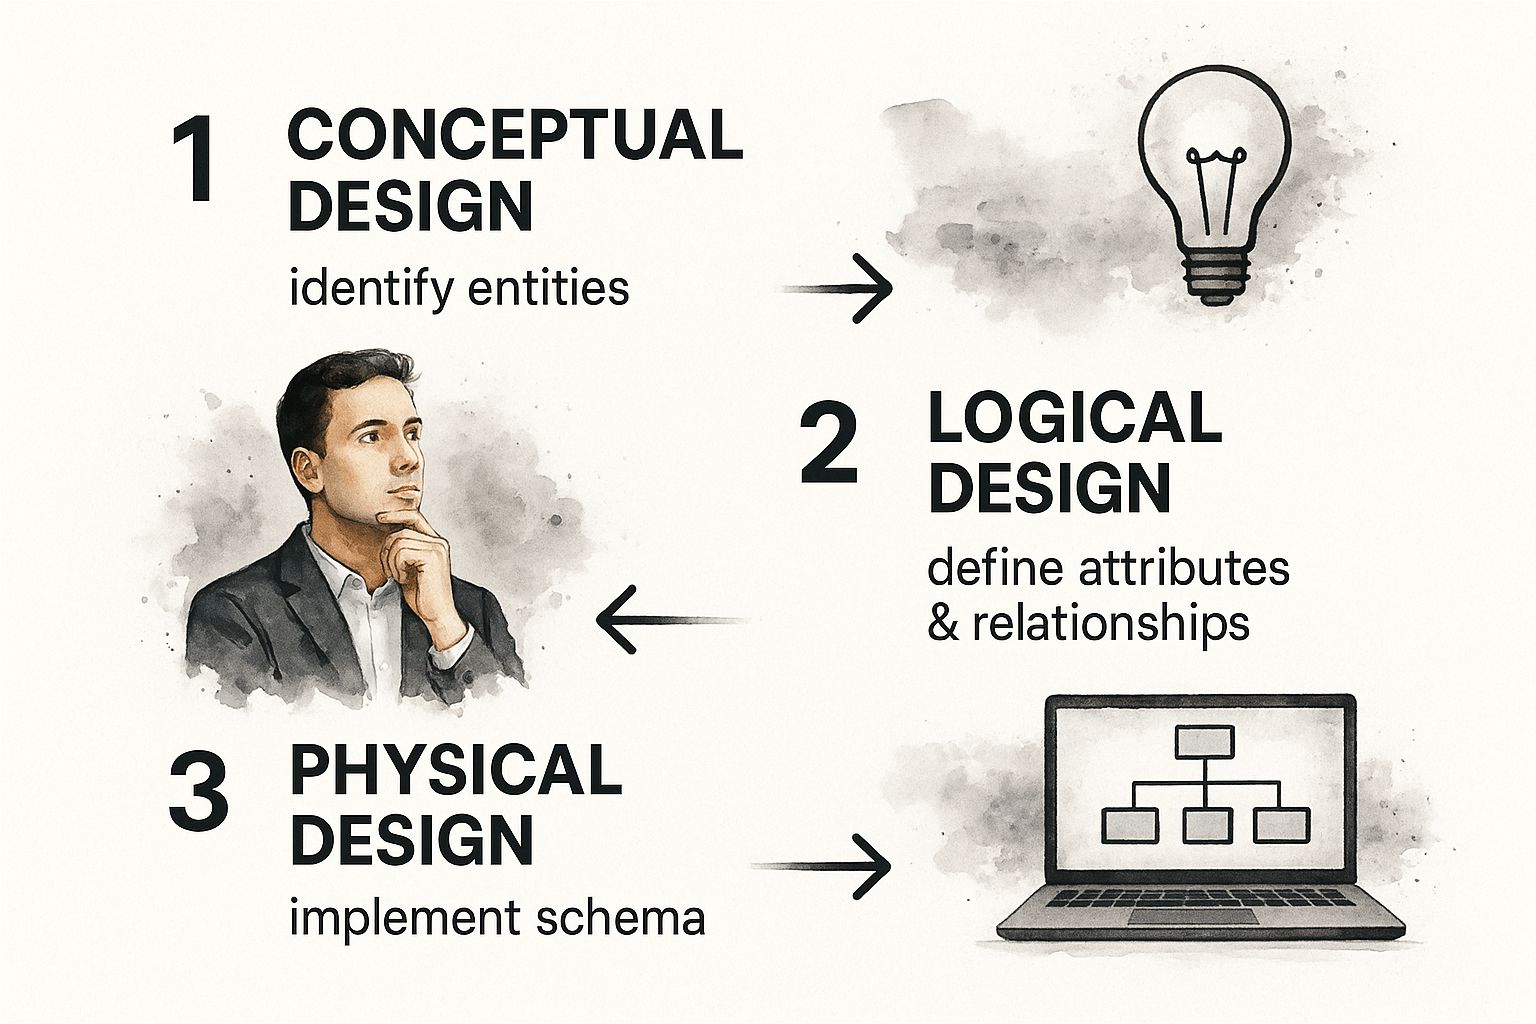
First up is the conceptual model. This is your 30,000-foot view. You're simply identifying the major entities and the general ways they relate to each other. No need for overwhelming detail here, just the big picture.
From there, you drill down into a logical model. This is where things get more specific. You’ll define the attributes for each entity (like player_name or team_city) and, most importantly, the cardinality of their relationships.
Cardinality is just a fancy word for the numerical rules of the relationship. For instance, the rule "one Team can have many Players" defines a classic one-to-many relationship. Getting these rules right is what gives your model its structural integrity.
By the way, if you find this kind of system-building exciting, a career in sports analytics might be a perfect fit. You can always check out current opportunities in the field to see what's out there.
Drawing the Relationships
So what does this look like in practice? An ERD uses standard symbols, usually rectangles for entities and lines for relationships, to map everything out.
For our basketball analytics model, we’d start drawing lines to connect the dots:
- A line from the 'Teams' entity to the 'Players' entity, marked to show a one-to-many relationship.
- A line from 'Players' to 'Stats', indicating that one player can have many individual stat lines across a season.
- A connection between 'Games' and 'Teams' to represent the home and away team for each matchup.
As you sketch these connections, you'll start to see your logic take shape. It’s during this process that you might have an "aha!" moment, realizing you need a separate 'Contracts' entity to properly track a player's history as they move between teams. Catching that now saves you from a world of pain later.
This ability to translate business needs into a clear technical diagram is a seriously valuable skill. High-level roles, like a Financial Analyst position with the ADHC and the NHL, rely on this kind of thinking to make sense of complex data ecosystems. Mastering ERDs is a fundamental step toward landing that kind of job.
Building the Database with Practical SQL

Alright, our ERD is complete. Now it’s time to get our hands dirty and turn that blueprint into a living, breathing database. This is where the abstract concepts of data modeling become tangible structures, and we'll use SQL, the universal language of databases, to do it.
This part is all about practical application. We’re going to run through the CREATE TABLE statements that will form the digital skeleton of our sports analytics system. You'll see exactly how each entity from our diagram transforms into a functional table, ready to store and organize our data.
From Diagram to CREATE TABLE
The beauty of a well-made ERD is that it gives you a clear roadmap. Every entity becomes a table, and its attributes become columns. Those relationships we mapped out? We'll enforce them with keys, the critical links that hold our database together.
Let’s start with the easiest one: the Teams table. It’s a great starting point because it doesn't rely on any other tables.
CREATE TABLE Teams (
    TeamID INT PRIMARY KEY,
    TeamName VARCHAR(100) NOT NULL,
    City VARCHAR(100)
);
Here, TeamID is our primary key. Think of it as a unique ID number for each team, like a driver's license. It’s a non-negotiable rule that ensures no two teams can share the same ID, which is crucial for preventing data mix-ups down the line.
This kind of hands-on SQL skill is at the core of so many jobs in the sports tech world. If translating diagrams into working databases gets you fired up, you might be a perfect fit for a role like this Business Intelligence Intern role, where building and maintaining data systems is the name of the game.
Defining Players and Their Attributes
Next up, we’ll build the Players table. Look closely, and you'll see a TeamID column. This is our first look at a foreign key.
CREATE TABLE Players (
    PlayerID INT PRIMARY KEY,
    FirstName VARCHAR(50),
    LastName VARCHAR(50),
    Position VARCHAR(5),
    TeamID INT,
    FOREIGN KEY (TeamID) REFERENCES Teams(TeamID)
);
A foreign key is a field in one table that points directly to a primary key in another table. In this case, the
TeamIDinPlayerscreates a link back to a specific team in theTeamstable. This is how we enforce the relationship from our ERD, making sure every player is officially tied to a valid team.
Choosing the right data types is another key decision here. We're using VARCHAR for text like names and INT (integer) for the IDs. If we were tracking game days, we'd use a DATE or DATETIME type. Picking the right type is more than just a formality; it keeps your data clean and makes your database run more efficiently.
Tying It All Together with the Games Table
Finally, let's create the Games table. This one’s a bit more complex because it acts as a hub, linking multiple entities together to capture a single event.
To record a game, the table needs to know which two teams played. To do that, it will have two separate foreign keys that both point back to the Teams table.
HomeTeamID: References theTeamIDof the home team.AwayTeamID: References theTeamIDof the away team.
Here's the SQL to make it happen:
CREATE TABLE Games (
    GameID INT PRIMARY KEY,
    GameDate DATE,
    HomeTeamID INT,
    AwayTeamID INT,
    HomeTeamScore INT,
    AwayTeamScore INT,
    FOREIGN KEY (HomeTeamID) REFERENCES Teams(TeamID),
    FOREIGN KEY (AwayTeamID) REFERENCES Teams(TeamID)
);
And just like that, we've implemented the physical layer of our sports data model. By defining these tables and keys, we’ve built a solid structure. Now it’s ready to be populated with data and, eventually, queried to uncover some powerful insights.
Putting Your Analytics Model to the Test
A model on paper is just a good plan. The real magic happens when you bring it to life and see if it actually works. This is where we get our hands dirty, populating our new database with some sample data and running a few queries to make sure everything clicks into place.
Think of it as a shakedown cruise for your data model.
First things first, we need some data. We'll use simple SQL INSERT statements to create some fictional records for our tables. For example, let's invent a couple of teams, like the "Downtown Dynamos" and the "Uptown Aces." Then, we can start adding imaginary athletes to our Players table, making sure we link each one back to their team.
Filling the Database with Sample Data
This part is pretty straightforward. You'll just write a sequence of commands to add records that mimic what you'd see in the real world.
- Start with Teams: Since other tables rely on
Teams, you have to get them in the database first. No team, no players. - Then, Add Players: Each player record needs a
TeamIDto link back to one of the teams you just created. - Finally, Log a Few Games: Create some game records connecting two teams and punch in the final scores.
This process is what breathes life into your structure. Honestly, if you find this kind of logical problem-solving fun, you should know that teams and companies are desperately looking for people with these exact skills. If you want a job in this industry, you can visit www.sportsjobs.online to see how this knowledge translates directly into real jobs.
Once our database has some data to chew on, we get to the most important part: asking it questions.
Querying for Insights
The ultimate acid test is whether our model can actually deliver the insights we designed it for. This is where we'll write SELECT queries that use JOINs to pull information from multiple tables at once, verifying our relationships are all set up correctly.
For instance, a classic question might be, "Who was the top scorer for the Downtown Dynamos?"
Getting that answer isn't a single-table lookup. A good query would need to:
JOINthePlayersandStatstables usingPlayerID.JOINthat result with theTeamstable onTeamID.FILTEReverything down to just the "Downtown Dynamos".ORDERthe final list by points scored, from highest to lowest.
This validation step is non-negotiable. It’s the final quality check that ensures your database isn't just a glorified spreadsheet but a powerful analytical engine ready for prime time. It confirms the model can answer the questions you set out with and is structurally sound.
This whole process is becoming more critical across the industry. According to a 2024 survey, 64% of organizations are now actively using data modeling, which is a 13% jump from just the year before. It’s a clear signal that the demand for pros who can build and validate solid data assets is only going up. You can read more about how data modeling simplifies complex problems to get a feel for the latest trends.
If your queries spit out the results you expected, then congratulations. You’ve successfully built a functional sports analytics database from the ground up.
You've made it through the heavy lifting of data modeling, but a few questions might still be swirling around. That's completely normal. Let's tackle some of the most common ones I hear from people just starting out.
What's the Real Difference Between a Logical and a Physical Data Model?
Think of it this way: the logical data model is your architect's blueprint. It’s conceptual. You're mapping out the business rules, what the data is and how different pieces relate. For example, your logical model would simply state, "a player belongs to a team." It's all about the 'what,' not the 'how.'
The physical data model is what the construction crew actually builds from that blueprint. This is where you get your hands dirty. You're defining the specific table names, choosing data types like VARCHAR or INT for each column, and setting up the primary and foreign keys. This is the 'how', the concrete plan for building it in a specific database system like MySQL.
How Do You Actually Change a Model Once the Database Is Live?
This is a huge, and often stressful, part of the job. Modifying a live database, a process called schema evolution, is serious business. You can't just wing it. The professional standard is to use database migration tools. Think Flyway or Alembic.
These tools bring version control to your database, just like Git does for your code. Need to add a column or a new table? You write a new, timestamped migration script. This keeps the process orderly, trackable, and repeatable. It's the only way to ensure changes are applied consistently across all your environments (dev, staging, production) without accidentally wiping out data.
I can't stress this enough: never, ever make changes directly on a production database. A disciplined, scripted approach is your safety net. It prevents catastrophic mistakes and makes rolling back a bad change a simple, low-panic affair.
What Are the Common Mistakes I Should Watch Out For?
I've seen a few recurring tripwires over the years. Over-normalization is a classic, where you break down your model into so many tiny tables that even a simple query becomes a spaghetti-like mess of joins. On the flip side, under-normalization leads to data redundancy and a nightmare of update anomalies.
Beyond those, here are a few other pitfalls to dodge:
- Vague Naming Conventions: Don't make your future self (or your teammates) hate you.
PlayerFirstNameis infinitely better thanpfn. Be descriptive. - Forgetting the Future: Your model needs to breathe. If it's so rigid that it can't handle new stats, new rules, or new business questions, it’s already obsolete.
- Ignoring the "Why": The whole point of the model is to answer business questions. If you don't start by deeply understanding what the front office or coaching staff needs to know, you're just building a technical exercise with no real-world value.
Nailing these details is what separates a good analyst from a great one. If you feel ready to put these skills to the test in a professional setting, it’s a great time to see who’s hiring. You can find all sorts of roles for data experts on www.sportsjobs.online.
Ready to find your spot in the sports analytics world? At Sportsjobs Online, we’re all about connecting talented analysts, data scientists, and engineers with top-tier teams and sports tech companies. Head over to our job board at https://www.sportsjobs.online and find that role that could define your career.
Hundreds of jobs are waiting for you!
Subscribe to membership and unlock all jobs
Sports Analytics
We scan all major sports and leagues
Updated Daily
New jobs are added every day as companies post them
Refined Search
Use filters like skill, location, etc to narrow results
Alerts
You can get daily alerts in your email for a specific search
Monthly
$6.99
per month
✓ Flexible monthly billing
✓ Unlimited access to all jobs
✓ Advanced filtering tools
✓ Exclusive discount codes
✓ Cancel anytime
BEST VALUE
Yearly
$39
per year • Only $3.25/mo
✓ Save 50% vs monthly
✓ Unlimited access to all jobs
✓ Advanced filtering tools
✓ Exclusive discount codes
✓ Cancel anytime
Lifetime
$59
one-time • forever
✓ Pay once, access forever
✓ Unlimited access to all jobs
✓ Advanced filtering tools
✓ Exclusive discount codes
✓ Best long-term value