
A Guide to Sports Betting Data Analysis
Ever wondered how some bettors seem to have a crystal ball for sports? Chances are, it's not magic. It's data.
Sports betting data analysis is all about using historical stats and real-time information to find patterns that predict game outcomes. Think of it like a weather forecast, but for sports. Instead of tracking atmospheric pressure and wind speed, you're digging into player stats, team performance metrics, and betting odds to get a clearer picture of what might happen next.
This approach moves you away from just gut feelings and hot takes and pulls you toward making decisions backed by actual evidence.
Decoding the Game with Data
At its heart, sports betting data analysis is the craft of turning raw numbers into real, actionable insights. It’s a systematic way of combing through massive datasets to uncover hidden trends, relationships, and an edge over the bookmaker's odds. You're basically hunting for value that everyone else has overlooked.
This goes way beyond simply glancing at a team's win-loss record. It’s about digging deep to understand the why behind those wins and losses. For example, knowing a basketball team wins a lot is one thing. Discovering they win because their defensive efficiency is in the top 5% of the league is an insight you can actually work with.
To really get a handle on this, let's break down the key components involved in the process.
Key Components of Sports Betting Data Analysis
This table outlines the core elements you'll be juggling, from finding the right numbers to building a predictive model.
| Component | Description | Example |
|---|---|---|
| Data Collection | Gathering raw data from various sources. This is your foundation. | Scraping player performance stats, injury reports, and historical odds. |
| Data Cleaning | Organizing and standardizing the data to make it usable. | Removing duplicate entries, handling missing values, and formatting dates correctly. |
| Exploratory Analysis | Initial investigation of the data to find patterns and anomalies. | Visualizing a team's scoring trends at home versus on the road. |
| Feature Engineering | Creating new variables from existing data to improve model accuracy. | Calculating a "fatigue score" based on a team's recent travel schedule. |
| Model Building | Applying statistical or machine learning methods to make predictions. | Using a regression model to predict the total points scored in a game. |
| Backtesting | Testing your model on historical data to see how it would have performed. | Simulating bets based on your model's predictions for the last two seasons. |
Each piece of this puzzle is crucial for building a solid, data-driven betting strategy.
The Real Goal of Analysis
The ultimate objective here is to make smarter, more informed predictions. By applying statistical methods, you can start to quantify the probability of certain outcomes, shifting from a simple guess to a calculated assessment. It's a structured process that helps you spot mismatches between what the data is telling you and what the betting markets are offering.
The true power of sports betting data analysis isn't about nailing every single bet. It's about consistently making smarter choices that stack the odds in your favor over the long run.

This is a massive, booming industry. The global sports betting market was valued at around USD 103.05 billion and is on track to more than double by 2032, hitting an estimated USD 233.76 billion. That incredible growth is fueling a huge demand for people with sharp analytical skills. You can find more market trend insights to see just how big this opportunity is.
From Hobby to Profession
What might start as a passion for sports and numbers can absolutely become a legitimate career. The skills you build in sports betting analysis are the exact same ones needed for professional roles at sports teams, media giants, and betting companies. The demand for people who can actually interpret data and tell a story with it is at an all-time high.
If turning this interest into a full-time gig sounds like a plan, you can start exploring roles for data analysts and quants over at sites like www.sportsjobs.online.
This guide is designed to walk you through the fundamentals, proving you don’t need a Ph.D. in statistics to get started. We’re going to cover:
- Finding the Right Data: Where to get reliable information that you can trust.
- Core Analytical Methods: Simple, effective techniques to kickstart your analysis.
- Building Your First Model: A practical, step-by-step example to get your hands dirty.
By the time you're done, you'll have a clear roadmap for using data to make sharper, more strategic bets.
Finding and Using the Right Sports Data
Let's get one thing straight: your insights are only as good as your data. It's the oldest rule in the book, often repeated as "garbage in, garbage out." The real challenge isn't just finding data; it's finding the right data, the kind that’s clean, reliable, and actually answers the questions you’re asking.
Thankfully, there are tons of options out there, from free public resources to super-specialized paid services. The trick is knowing where to look and how to tell the good from the bad.
Free versus Paid Data Sources
If you're just starting out, free data sources are your best friend. They're a fantastic way to get a feel for things without pulling out your credit card.
- Free Sources: Websites like ESPN, Fox Sports, and official league sites (think NFL.com or NBA.com) are goldmines for basic team and player stats. You can also find public APIs that offer structured data for free, though they might cap how much you can use.
- Paid Sources: Once you get more serious, you'll probably want to look into paid providers. These services offer much cleaner, deeper datasets. We're talking historical betting odds, advanced metrics like Player Efficiency Rating (PER) in basketball, and even real-time injury news.
It really boils down to a classic trade-off: time versus money. With free sources, you’ll spend a lot of your own time grabbing and cleaning up the data. Paid services handle all that grunt work for you, delivering analysis-ready data so you can jump right into the fun part.
This data wrangling is a huge part of the professional world; many companies have people who do nothing but this. If that sounds interesting, check out a role like a quantitative sports researcher to see what the pros are looking for.
The Types of Data You Need
The secret to sharp sports betting analysis is layering different kinds of information. You need to build a complete picture of a matchup, and that means looking way beyond a simple win-loss record.
Here are the key categories you should be hunting for:
- Player Performance Stats: The nitty-gritty individual numbers. A quarterback’s completion percentage, a striker's shots on goal, or a pitcher's ERA are all good examples.
- Team Historical Data: How does a team behave in specific situations? Look at their record at home versus away, or how they play coming off a bye week.
- Betting Odds History: Watching how odds move tells you a lot about what the market thinks. Spotting these shifts can help you find value.
- Situational Factors: This is where you can find a real edge. Things like weather conditions, referee assignments, or even how far a team had to travel can have a subtle but significant impact.
The real goal here is to assemble a dataset that captures all the different threads that can influence a game's outcome. The more angles you can cover, the better your chances of spotting a pattern that everyone else has missed.
Building Your Own Database
Okay, so you've started collecting all this great info. Now what? You need a place to keep it organized.
You don't need some massive, complex system to get going. A simple spreadsheet program like Microsoft Excel or Google Sheets is more than powerful enough. You can use it to track team stats, log your bets, and do some basic number-crunching.
As your skills grow and your data piles up, you might graduate to something more robust. A dedicated database using SQL, for example, can handle enormous datasets and lets you run much more sophisticated queries. The most important thing is to start with a system you're comfortable with and build up from there. A clean, organized database is the foundation of any solid analysis project.
Core Methods for Analyzing Sports Data

So, you've got your hands on some solid data. What's next? This is where the real fun of sports betting data analysis begins. Don't worry, you don't need a PhD in statistics to get started. All it takes is a grasp of a few core methods to start seeing the patterns hiding in the numbers.
Think of these methods as different tools in your workshop. Each has a specific job, but they all work toward the same goal: helping you evaluate matchups logically and sniff out potential value in the betting odds.
Uncovering Relationships with Regression Analysis
One of the most powerful tools in your kit is regression analysis. Put simply, it’s a way to see how one thing affects another. For instance, you might want to know just how much a quarterback's passing yards per game actually influences the final score.
Regression analysis draws a line through your data points, showing you the underlying trend. This moves you beyond pure guesswork and into the realm of data-backed predictions. You might discover that for every extra 50 passing yards, a team's final score tends to jump by 3 points. That kind of specific, measurable insight is exactly what gives you an edge.
These are the exact skills that pro teams and companies are hungry for. If digging into these relationships sounds exciting and you're thinking about a career, check out www.sportsjobs.online to see how data analysts are making a real impact in the sports world.
Understanding Your Chances with Probability
Probability is the native language of betting. It's all about putting a number on how likely something is to happen. Bookmakers do this with odds, but when you can calculate your own probabilities, you can spot when their numbers seem a little off.
Let's say your data shows a particular home team wins 60% of its games against teams with a losing record. If the bookie's odds only imply a 50% chance of winning, you've just found a potential value bet. It all comes down to comparing your calculated probability to the market's.
At its core, successful betting is about finding discrepancies between your analysis and the bookmaker's odds. When your data suggests an outcome is more likely than the odds imply, you've found a potential opportunity.
Finding Value with Expected Value (EV)
This leads us to the single most important concept for any profitable bettor: Expected Value (EV). EV is a simple idea that tells you, on average, how much you can expect to win or lose on a bet if you made it a thousand times over.
A bet with a positive Expected Value (+EV) is, over the long haul, a profitable one. A bet with a negative Expected Value (-EV) is a loser. Your entire goal as a data-driven bettor is to consistently find and place +EV bets.
Here’s the simplified formula to get you started:
- (Probability of Winning x Amount Won per Bet) - (Probability of Losing x Amount Lost per Bet)
Let's break it down. Imagine you bet $10 on a team you've calculated has a 55% chance to win, and the odds pay out $10 in profit. The math looks like this: (0.55 * $10) - (0.45 * $10) = $5.50 - $4.50 = +$1.00. This means that for every $10 you wager on this bet, you can expect an average profit of $1.00 over time.
This simple calculation is the cornerstone of a disciplined strategy, turning betting from a pure gamble into a calculated risk.
How AI Is Changing Sports Betting Analysis
While old-school statistical methods still give you a solid foundation, the real game-changer in sports betting data analysis is Artificial Intelligence (AI) and Machine Learning (ML). These technologies are flat-out brilliant at uncovering the kinds of subtle patterns in massive datasets that even the sharpest human analyst would miss.
Think of an AI model like a chess grandmaster who can see countless moves ahead, but for sports data. It can juggle thousands of variables at the same time, from player stats and team strategies to real-time betting market shifts, all to pinpoint predictive signals that give you an edge.
AI helps create far more accurate predictive models. For instance, an ML model can learn exactly how specific player matchups, travel fatigue, and even referee tendencies combine to shape a game's outcome. That's a level of nuance that's incredibly difficult to quantify by hand.
The Power of Predictive Modeling with AI
AI-driven models don't just spit out predictions based on past games. They actually learn and adapt as new data comes in. They're built to spot the complex, non-linear relationships in data that a simple regression analysis would fly right past.
So, what makes these models so powerful?
- Handling Complexity: They can analyze hundreds or thousands of features at once, from basic box scores to advanced player-tracking metrics.
- Dynamic Adaptation: The models can be constantly retrained with fresh game data, ensuring they stay current with a team's or player's changing form.
- Finding Hidden Correlations: AI might discover that a team's performance tanks in the second game of a back-to-back series, but only when they're playing on the road. That’s a small detail that leads to much better predictions.
This leap in analytical power has created a huge demand for people who are fluent in both data science and sports. If you've got a passion for tech and analytics, you should definitely be exploring the kinds of roles popping up on sites like www.sportsjobs.online.
AI's Impact on the Betting Industry
It’s not just bettors who are getting in on the action. The bookmakers themselves rely on sophisticated algorithms to set and adjust odds in real time. These systems react instantly to new information, whether it's a last-minute injury to a star player or a huge wave of bets coming in on one side. It’s what makes the market so efficient, and so tough to beat without the right tools.
The rise of AI and machine learning is fundamentally reshaping the entire industry, leading to better predictions and more personalized betting experiences. In fact, the global sports betting market is projected to grow by a staggering USD 221.1 billion between 2025 and 2029. This growth is proof of the incredible impact of digital tools. You can read the full research on this market trend to get a sense of the scale.
The rise of AI in sports betting means that having a data-driven approach is more important than ever. It provides the tools to compete in an increasingly complex and fast-moving environment.
This technological shift is carving out exciting new career paths that fuse data science with sports operations. For example, a role like a Manager of Performance Science applies these very same analytical principles to help teams and athletes perform at their absolute peak.
Alright, let's get our hands dirty.
Theory is one thing, but the best way to really wrap your head around sports betting data analysis is to actually do it. So, let’s walk through a simple case study together. We're going to build a basic model to predict the total points in a pro basketball game, what bettors call the "over/under."
Don't worry about perfection right now. The goal is just to see the whole process in action, from start to finish. You can use this as a blueprint for your own, more sophisticated projects down the line.
Step 1: Selecting the Right Data
First things first, we need data. We have to pick a few key stats, or "features," that we think will drive the total score. For a basketball game, a few obvious candidates jump out:
- Team Offensive Rating: This is just points scored per 100 possessions. It’s a clean way to measure offensive firepower.
- Team Defensive Rating: The flip side, points allowed per 100 possessions. This tells us how good a team is at stopping others from scoring.
- Pace: How many possessions a team averages per game. Faster teams mean more possessions for everyone, which naturally leads to more chances to score.
You can find this kind of data for free on tons of sports stats websites. For our model, grabbing the numbers from the last 20-30 games for each team is a good starting point. It gives us a solid look at recent form without the data getting too stale.
This is the exact kind of foundational work sports data analysts do every single day. If this part of the process gets you excited and you want to build a career on it, you can check out real job openings in the sports industry at www.sportsjobs.online to see what's out there right now.
Step 2: Cleaning and Preparing the Data
Raw data is almost always a mess. It needs to be cleaned up before it's useful. For our basketball model, this means a few simple but critical steps. We’ll need to combine the offensive and defensive ratings for the two teams in every matchup.
We'd also average out their pace stats to get a single estimated pace for the game. Any games with missing numbers or weird outliers, maybe from data entry mistakes, have to be tossed out. If we don't, our model might learn the wrong lessons. What we're left with is a clean, organized spreadsheet where every row is a past game, complete with our key stats and the final combined score.
Step 3: Building and Testing the Model
With our clean data in hand, we can finally build the model. A simple linear regression is a great place to start. This technique finds the mathematical link between our features (offensive rating, defensive rating, and pace) and the outcome we care about (total points).
Basically, the model spits out an equation. We can then plug the stats for any two teams into that equation and get a predicted total score for their next game.
Building a model isn't just one step; it's a whole workflow, from gathering the data all the way to checking your results. This infographic gives a great high-level view of that process.
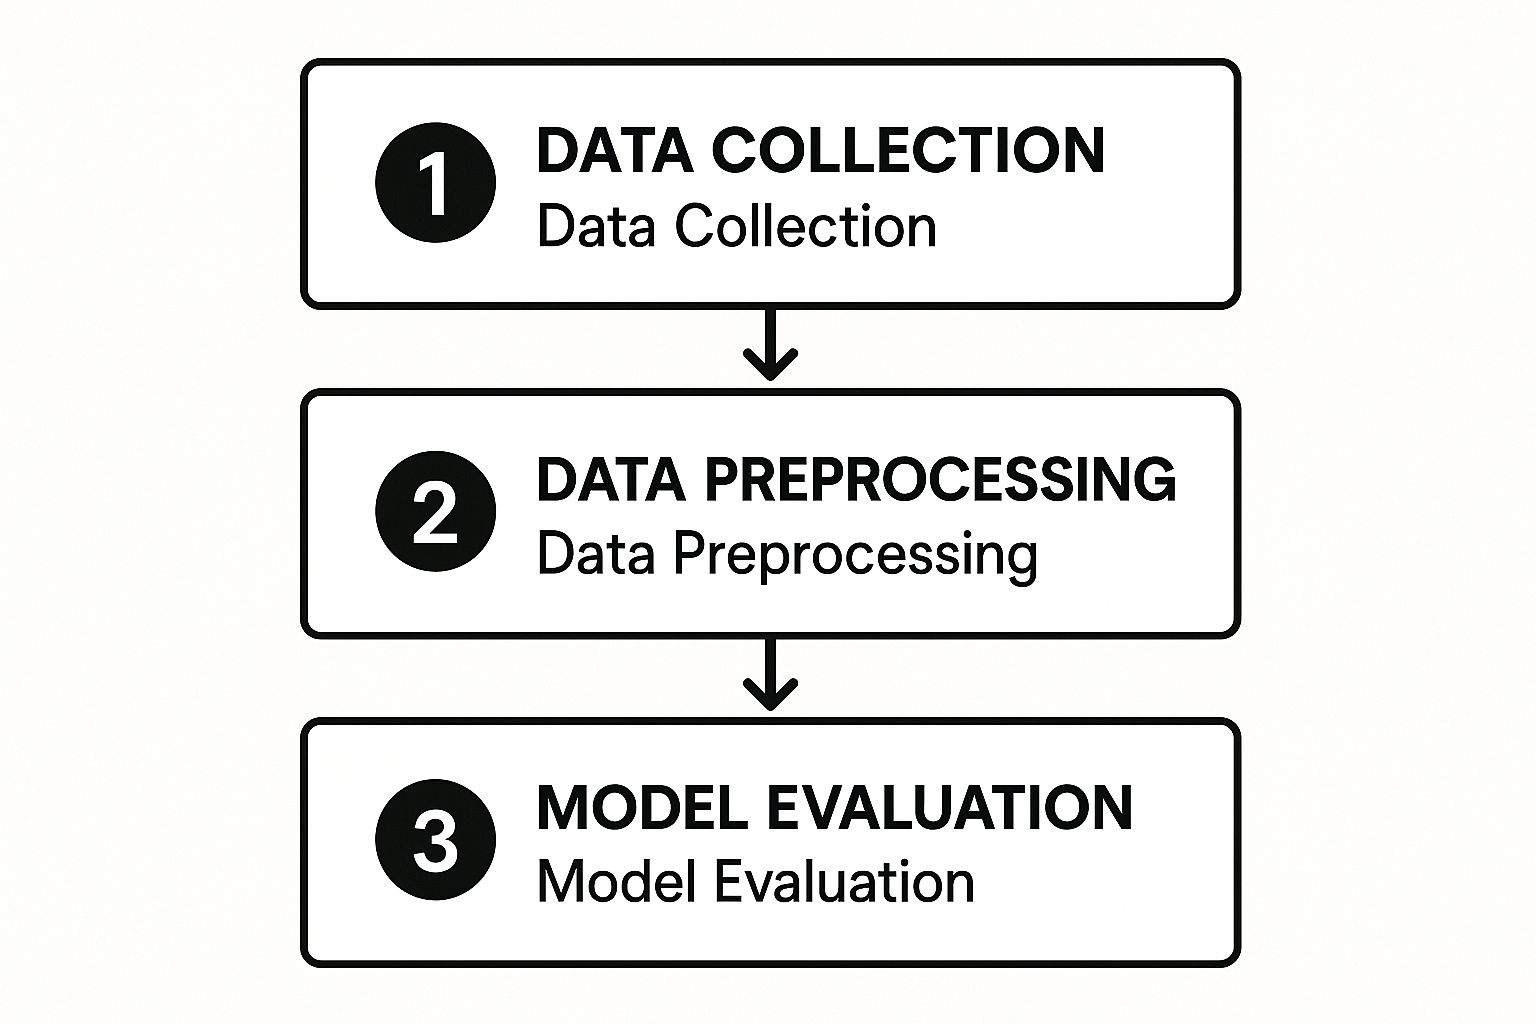
As you can see, good analysis is a logical path. Each step builds on the last, making sure your final model is built on a solid foundation.
Key Takeaway: The last, and maybe most important, step is testing. We'd take our shiny new model and use it to "predict" the scores of past games it’s never seen before. Then we compare its predictions to what actually happened. This is how we find out if our model is any good and where its blind spots might be.
How Global Trends Impact Betting Analysis

Let's get one thing straight: effective sports betting data analysis is not a one-size-fits-all game. A model you’ve perfected for the NFL in North America will almost certainly crash and burn if you try to apply it to cricket in India. Why? It's simple, really. Different places have their own unique sports, fan cultures, and completely different rules and regulations.
Knowing your way around these global nuances is what separates a decent analyst from a truly great one. You have to tailor your approach based on where you're playing. The data you need, the fan behaviors you’re tracking, and the legal hoops you have to jump through can change drastically from one country to the next.
Navigating Different Betting Markets
To see what I mean, let’s take a look at how some of the major global markets operate. Each one brings its own unique set of challenges and opportunities to the table.
- North America: This market is absolutely booming, especially with sports betting becoming legal across more and more of the U.S. and Canada. Here, the analysis is laser-focused on the big leagues: the NFL, NBA, and MLB. You'll find tons of high-quality data, but you'll also find a ton of competition.
- Europe: As a mature market, Europe has a deep-rooted history in sports betting, particularly with soccer. Analysts here are often juggling a massive number of leagues and tournaments, which means your models need to be able to scale up without breaking a sweat.
- Asia Pacific: This region is seeing explosive growth, but it's also incredibly diverse. A model built for the Indian Premier League (cricket) will need entirely different metrics than one for the K League (soccer) in South Korea.
Data analysis is your key to unlocking these regional differences in fan behavior and regulatory impacts. The Asia Pacific region, for instance, is growing faster than anywhere else, with a projected CAGR of about 10.8% between 2025 and 2034. This surge is being driven by more people using smartphones, better internet, and new regulations in places like India and the Philippines. If you want to dig deeper, you can discover the insights on the sports betting market.
The Professional Edge in a Global Industry
For professionals, getting a handle on these regional differences is a massive advantage. Companies that operate on a global scale are desperate for analysts who can build adaptable models. They need experts who get that a betting strategy for Australian Rules Football requires a completely different dataset and set of assumptions than one for European handball.
This is a highly sought-after skill, and international sports betting companies and analytics firms are always on the lookout for it. If turning your analytical talents into a global career sounds like your kind of thing, check out www.sportsjobs.online to find roles like data analyst in this exciting field.
The bottom line is this: context is everything. Your sports betting analysis has to be tailored to the specific sport, league, and regulatory environment you’re targeting if you want to succeed on a global scale.
Knowing how to navigate these international markets isn't just a bonus, it's a critical skill for senior roles. A position like a Business Operations Lead in the sports industry, for example, demands a deep understanding of how different regional trends can affect a company's overall strategy and growth.
Still Got Questions?
As you start digging into sports betting data, a few questions are bound to come up. It happens to everyone. Let's tackle some of the most common ones to clear things up and get you moving in the right direction.
Do I Really Need to Be a Math Whiz to Get Started?
Not at all. Look, while being a math genius helps if you're building incredibly complex models, you can get surprisingly far with just a solid grasp of basic stats and a logical approach. Simple tools like spreadsheets are more than enough to handle the fundamentals, like calculating averages or understanding basic probability.
Honestly, the most important thing is to start with simple, powerful concepts like Expected Value (EV) and build from there. Many of the sharpest analysts I know lean more on their deep, nuanced knowledge of a sport and their ability to find quality data than on writing crazy, complex equations.
Is Data Analysis a Guaranteed Way to Win Money?
Let's be crystal clear: absolutely not. There are no guarantees in betting, period. Sports are packed with randomness and human unpredictability. Even the most sophisticated model on the planet can't account for a star player twisting their ankle in the first quarter or a sudden, unexplainable momentum shift.
The goal of data analysis isn't to perfectly predict the future. It's to find bets that offer positive value over the long haul and to help you make smarter, more informed decisions. Over time, this disciplined approach can tilt the odds in your favor, but it's no magic bullet. Solid bankroll management is just as crucial as any model you build.
What Are the First Steps to Building a Simple Betting Model?
My best advice? Start small and stay focused. Don't try to boil the ocean.
First, pick one sport and one specific bet you know inside and out. For example, maybe you focus only on predicting the total goals ("Over/Under") in a soccer match. This narrows your focus and makes the whole process feel way less overwhelming.
Next, identify just three to five key stats you believe actually influence that outcome. For a soccer total, you might look at a team's average shots on goal, their recent defensive record, and their opponent's offensive form. By the way, the skills you pick up building even a simple model are exactly what teams and companies are looking for. If this stuff gets you excited, it's worth seeing what kind of opportunities are out there on platforms like www.sportsjobs.online.
Finally, grab that data for past games from a source you trust. Fire up a spreadsheet and start hunting for patterns and relationships between your chosen stats and the final scores. This hands-on, trial-and-error process is the single best way to learn what really moves the needle.
Where Can I Find Reliable Data for Sports Betting?
You can get a fantastic start with free and reputable sources. Think ESPN, Stats Perform, or even the official league websites for all your basic box score stats. For something a bit more advanced, you can check out sports-focused APIs; many have free tiers that are perfect for getting your feet wet on personal projects.
Once you get more serious, you might consider paying for data. These professional services usually offer much cleaner, richer datasets that can include things like historical odds movements or advanced player-tracking metrics.
Always, always double-check your data for consistency. Know where it came from before you ever plug it into a model. Good analysis is built on a foundation of good data.
Ready to turn your passion for sports analytics into a career? At Sportsjobs Online, we connect talented analysts, data scientists, and engineers with top teams and companies in the sports industry. Find your next opportunity at https://www.sportsjobs.online.
Hundreds of jobs are waiting for you!
Subscribe to membership and unlock all jobs
Sports Analytics
We scan all major sports and leagues
Updated Daily
New jobs are added every day as companies post them
Refined Search
Use filters like skill, location, etc to narrow results
Alerts
You can get daily alerts in your email for a specific search
Monthly
$6.99
per month
✓ Flexible monthly billing
✓ Unlimited access to all jobs
✓ Advanced filtering tools
✓ Exclusive discount codes
✓ Cancel anytime
BEST VALUE
Yearly
$39
per year • Only $3.25/mo
✓ Save 50% vs monthly
✓ Unlimited access to all jobs
✓ Advanced filtering tools
✓ Exclusive discount codes
✓ Cancel anytime
Lifetime
$59
one-time • forever
✓ Pay once, access forever
✓ Unlimited access to all jobs
✓ Advanced filtering tools
✓ Exclusive discount codes
✓ Best long-term value