
Your Guide to a Sports Analytics Dashboard
Think of a sports analytics dashboard as the mission control for any modern sports organization. It's the central hub that pulls together mountains of complex data from all over the place, translating it into clear, easy-to-read visuals like charts and heatmaps. This is how teams finally get out of spreadsheet hell and start making smarter, faster decisions.
What Is a Sports Analytics Dashboard
Ever tried to understand a movie by looking at thousands of individual film frames scattered across a table? You wouldn't be able to piece the story together. That's what looking at raw sports data feels like.
A sports analytics dashboard takes all those scattered frames and organizes them into a coherent, flowing film. It's a single, powerful tool that collects, processes, and displays information from a whole host of different sources. It’s not about final scores and basic player stats. A good dashboard weaves together a complete performance narrative using data from places like:
- Player Tracking Systems: Data from wearable sensors monitoring an athlete's speed, distance covered, and heart rate during games and practices.
- Game Footage Analysis: AI-powered video tools that can break down every single play, identifying tactical patterns and player movements.
- Scouting Reports: All the digital notes and ratings on opponents' strengths and weaknesses.
- Biometric Data: Critical info on sleep, recovery, and other health metrics that directly impact an athlete's readiness to perform.
By pulling all these disconnected data streams into one place, a dashboard creates that unified, "mission control" view that is absolutely essential for gaining a competitive edge.
The Core Functions of a Dashboard
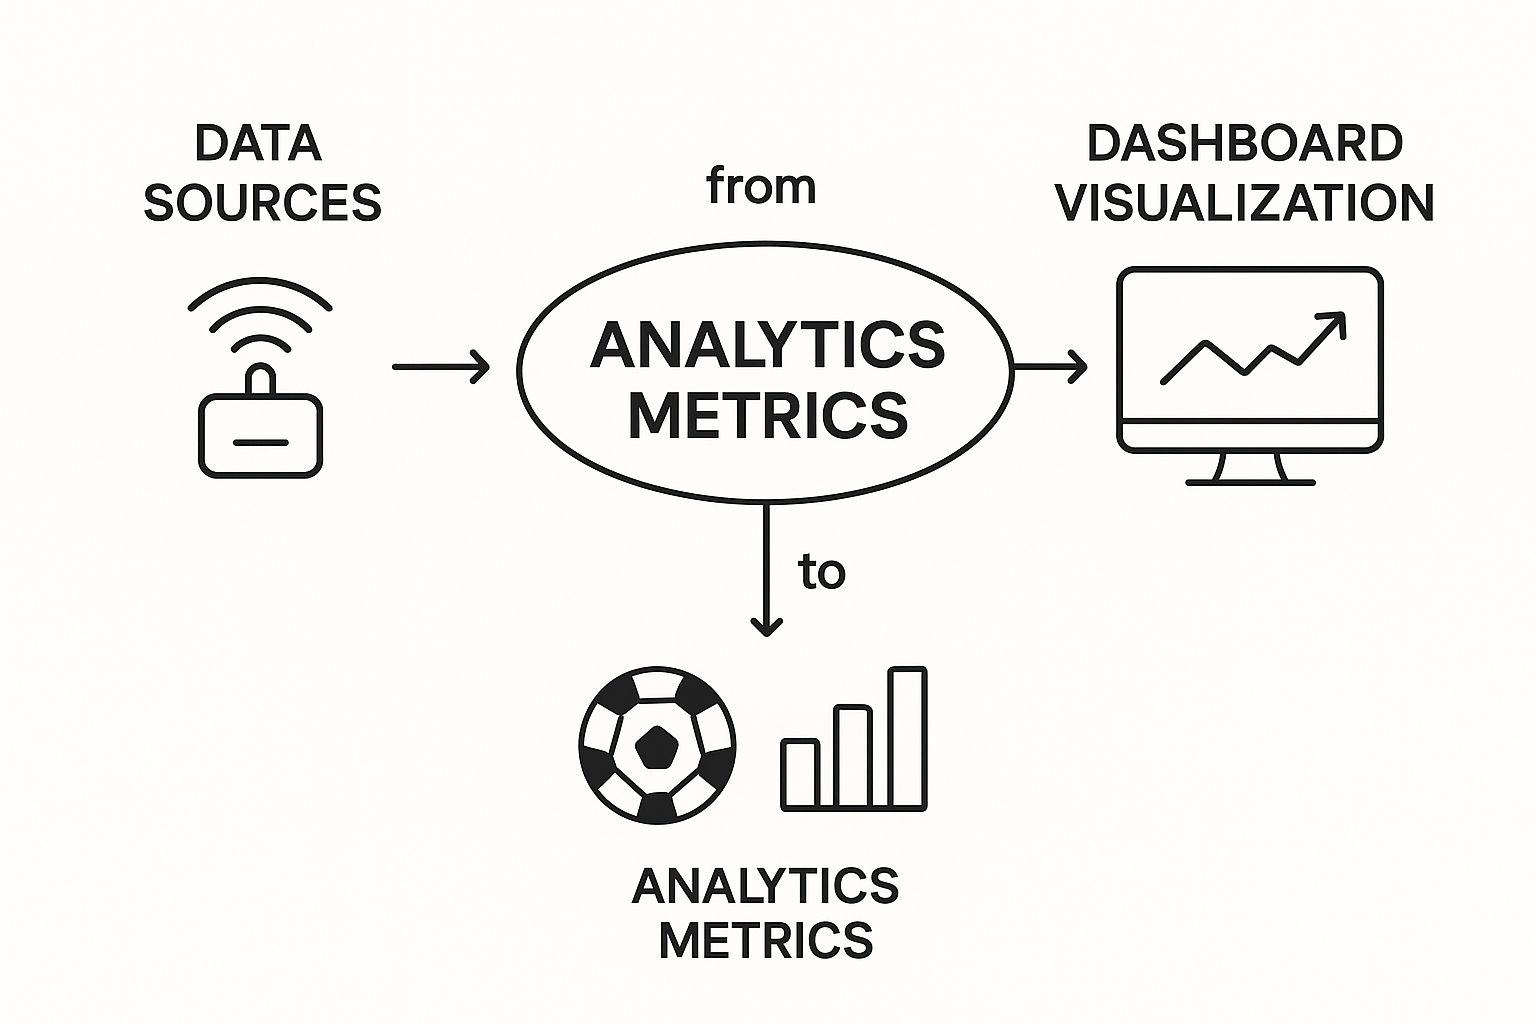
At its heart, a sports analytics dashboard has one main job: to turn raw, messy numbers into clear, actionable insights. It acts as a translator, converting complex datasets into a language that coaches, analysts, and even the players themselves can understand and use immediately.
The process is pretty straightforward, as this visual shows. Data flows from various sources, gets analyzed, and is then presented on the dashboard in a way that guides what you do next.
This table breaks down the key capabilities that a dashboard brings to the table for different people within the organization.
Core Functions of a Sports Analytics Dashboard
| Function | Description | Primary User |
|---|---|---|
| Data Aggregation | Collects and centralizes data from diverse sources like wearables, video, and scouting reports into a single location. | Data Analysts, IT Staff |
| Performance Monitoring | Tracks key performance indicators (KPIs) for individual athletes and the team as a whole, often in real-time. | Coaches, Performance Staff |
| Tactical Analysis | Visualizes game-day strategies, opponent tendencies, and player positioning to inform game planning. | Coaches, Video Coordinators |
| Player Load Management | Monitors athlete workload and recovery metrics to optimize training schedules and reduce the risk of injury. | Sports Scientists, Trainers |
| Recruitment & Scouting | Compares potential recruits against existing players and benchmarks using objective data points. | General Managers, Scouts |
Ultimately, these platforms are all about empowering everyone in the organization to act on solid evidence, not just gut feelings.
The demand for these tools is exploding. The global sports analytics market is projected to skyrocket from around USD 6 billion in 2025 to over USD 36.2 billion by 2035. That kind of growth tells you just how vital this technology has become, touching everything from on-field tactics to off-field business strategy. You can discover more about the sports analytics market growth and its massive impact.
A great dashboard doesn't just show you what happened. It helps you understand why it happened and guides you on what to do next. It connects the dots between practice, in-game execution, and the final result.
These tools empower everyone, from the head coach fine-tuning a game plan to the trainer managing player fatigue. If building or using these dashboards sounds like your kind of challenge, the industry is booming with opportunities. You can start exploring careers at sites like www.sportsjobs.online.
Essential Features of a Winning Dashboard
Let's be honest, not every platform that throws up a few charts is genuinely useful. A true sports analytics dashboard is a dynamic command center built for making decisions. The difference between a basic data display and a tool that actually wins games comes down to a handful of critical features.
Think of it this way: a standard car dashboard tells you your speed, but a fighter jet's cockpit gives a pilot the real-time, mission-critical info needed to perform at the highest level. That's the leap we're talking about, moving beyond simple graphs to features that deliver deep, contextual insight when it matters most.
The real goal is to make complex data intuitive. When a coach can grasp a predictive model as easily as a basic box score, you know the dashboard is doing its job right.
Data in Motion: Real-Time Feeds
The power to see what's happening right now is a huge advantage. Reports showing what happened last week are great for post-mortems, but games are won and lost in the moment. A great dashboard has to plug directly into live data sources.
- During Practice: Imagine wearable sensors streaming player load data straight to the dashboard. Trainers can instantly spot who's overexerting and might be at risk for an injury.
- On Game Day: Live stats and tracking data can reveal an opponent's tendencies or expose a defensive gap as it happens, giving coaches the intel to make immediate, game-altering adjustments.
This live capability transforms the dashboard from a historical record into a living, breathing part of the team's tactical brain.
Customizable Views for Every Role
A head coach, a medical trainer, and a scout all need different information to excel. A one-size-fits-all dashboard just creates clutter and confusion. This is where customization becomes non-negotiable.
A powerful sports analytics platform lets each user build their own personalized view, filtering out the noise and focusing only on the metrics vital to their job. The head coach might get a high-level summary of team performance and tactical success. Meanwhile, the trainer sees a granular breakdown of player workload, sleep patterns, and recovery scores.
This tailored approach ensures everyone gets clear, actionable information without drowning in irrelevant data. It also means people will actually use the tool because it directly helps them with their daily tasks.
Advanced Visualization and Video Sync
We're visual creatures. We process patterns and trends far quicker in charts and heatmaps than in dense tables of numbers. An effective dashboard needs to tell a story with its visuals.
A dashboard should tell a story with data. Heatmaps revealing shot patterns, charts showing player fatigue over a season, and diagrams illustrating successful plays are all elements of that story.
But the real game-changer is integrating video. The most advanced systems link specific data points directly to the corresponding game footage.
Think about a performance analyst who sees a player's sprint speed suddenly drop in the data. Instead of just guessing what happened, they can click that data point and instantly watch the video of the exact play. This fusion of "what" (the data) and "why" (the video) is incredibly powerful for coaching and player development. The demand for people who can connect these dots is growing, as you can see in roles like this Performance Analyst position, which requires a deep understanding of both data and video.
Predictive Power and Forecasting
The final piece of the puzzle is the ability to look ahead. By using historical data and machine learning algorithms, modern dashboards can run predictive models to forecast what might happen next.
- Injury Forecasting: By analyzing workload, movement asymmetry, and biometrics, a system can flag players with an elevated risk of injury in the coming days or weeks.
- Game Outcome Simulation: Dashboards can run thousands of simulations to project the likely outcome of a game based on different lineups or strategic changes.
This predictive capability allows teams to shift from being reactive to proactive. It helps them make smarter decisions to prevent problems before they start and to jump on opportunities others don't see coming. For anyone fascinated by this blend of data and strategy, checking out career paths on platforms like www.sportsjobs.online is a great way to see how these skills are being applied across the industry.
Improving Player Performance and Health
One of the biggest wins for any team using a sports analytics dashboard is managing player health and output. It’s all about flipping the script, moving from a reactive model where you’re just treating injuries to a proactive one where you stop them from ever happening. This is where data goes beyond gameday strategy and becomes your best tool for protecting the team's most valuable asset: its players.
Think of it like the warning system in a high-performance race car. That system doesn't just flash a light when the engine explodes; it alerts the pit crew to tiny changes in pressure or temperature, letting them make adjustments before a disaster. A dashboard does the exact same thing for an athlete, tracking everything from their workload in practice to how well they slept last night.
This kind of detailed monitoring means teams can finally ditch the old one-size-fits-all training plans. Instead, they can build highly personalized programs that are dialed in to each athlete's specific needs and day-to-day readiness.
From Gut Feel to Data-Backed Decisions
For decades, coaches had to rely on experience and a gut feeling to know when a player was getting run down. That intuition is still valuable, but it's subjective and often misses the early warning signs. A sports analytics dashboard replaces that guesswork with hard, objective data, making player management incredibly precise.
By visualizing the key metrics, teams can spot dangerous trends before they turn into a season-ending injury. A dashboard might, for example, flag that a soccer player's fatigue is building up long before they pull a hamstring. It could also reveal which specific drills give a certain basketball player the biggest performance boost, making sure every single minute of practice counts.
A dashboard can connect a player's poor sleep quality on Tuesday night to a measurable drop in sprint speed and reaction time during Thursday's practice. This allows for an intervention, like adjusting their training load, before it impacts their game-day performance.
This data-first approach is quickly becoming the standard. The sports analytics market is pouring money into player monitoring, a sector valued at USD 3.08 billion in 2025 and projected to jump to USD 7.87 billion by 2029. This explosive growth shows just how committed the industry is to using data to keep athletes safe and performing at their best. You can read the full research about the sports analytics market to see just how fast things are moving.
Key Metrics for Athlete Well-being
To get the full story on an athlete's condition, a dashboard has to pull in a wide range of metrics, way more than just what happens on the field. The best systems integrate data from all over the place to build a complete, holistic view.
Here are some of the essentials:
- Workload Monitoring: This is data from GPS trackers worn during practices and games. It tracks things like total distance run, the number of high-intensity sprints, and acceleration forces. It's the number one way to prevent overtraining.
- Biometric Data: This is info from wearables that measure heart rate, heart rate variability (HRV), and breathing rate. A sudden dip or spike in these baseline numbers can be the first sign of fatigue, illness, or stress.
- Recovery Metrics: Data on sleep quality and duration is huge. Good dashboards often sync with apps and devices to see how well athletes are actually resting, because poor recovery is a massive red flag for injuries and poor performance.
Putting It All Together for Peak Performance
A dashboard's real magic is its ability to pull all this information together. It’s not about looking at these data points one by one, but seeing how they all connect and influence each other. A coach might notice an athlete's workload has been sky-high for a week straight, and at the same time, their sleep scores have been terrible. That combination is a major warning sign.
Armed with that insight, the coaching and medical staff can make smart calls. They might schedule a lighter practice, have the player do an extra recovery session, or just check in with them about their sleep habits. This kind of hands-on, data-informed management helps keep players on the field and playing at their absolute best.
The growing complexity here has created huge demand for sharp analysts who can actually interpret all this data. If this sounds like a cool career path, you should check out openings for roles like a Data Scientist in sports to see what skills teams are looking for. It's a field where you can have a direct impact on the health and success of athletes. And if you're hunting for a job in the industry, you can always visit www.sportsjobs.online.
Gaining a Tactical Edge on Game Day
Sure, individual player metrics are important, but a sports analytics dashboard really proves its worth as a weapon for team strategy. This is where analytics jumps from the practice facility straight onto the field, shaping the very decisions that can win or lose a game. It's the tool that helps a coach see the entire chessboard, not just the individual pieces.
The real magic is in how these platforms turn mountains of data into simple, actionable intel right in the heat of the moment. Coaches and analysts lean on dashboards for both in-game and post-game analysis, breaking down what worked, what didn't, and what the opponent is likely to throw at them next. This process doesn't just improve preparation; it turns it into a science and hands teams a serious tactical advantage.
Breaking Down Opponent Tendencies
Long before the opening whistle, a dashboard is a team’s go-to reconnaissance tool. By feeding it historical game data, coaches can uncover an opponent's habits and weaknesses with stunning clarity. Think of it as a dynamic scouting report that updates itself with every new piece of information.
Take a football coaching staff, for example. They can use a dashboard to analyze an opposing quarterback's habits on third down. The system can instantly visualize their favorite plays, their go-to receivers, and how they perform under pressure. This kind of insight helps the defensive coordinator dial up the perfect call at the perfect time.
The Boston Celtics famously used AI-powered opponent analysis during a recent playoff run. By using machine learning to spot tiny patterns in how other teams rotated on defense, they found ways to attack weaknesses that would have been completely invisible to the human eye.
This level of deep-dive preparation isn't a luxury anymore; it’s the standard. The ability to spot these patterns is a huge asset. If you have a knack for finding trends and want to break into pro sports, you can find some incredible career opportunities over at www.sportsjobs.online.
Making Live, Data-Driven Adjustments
One of the most powerful things a sports analytics dashboard can do is inform decisions in real time. During a game, analysts on the sideline can monitor live data feeds and pass critical insights to the coaching staff. This allows for immediate adjustments based on what’s actually happening on the court or field.
Just picture these scenarios:
- Basketball: A real-time shot chart on a tablet shows that the opponent keeps leaving a specific spot on the three-point line wide open. The coach sees this on the dashboard and instantly calls a play to get their best shooter an open look from that exact location.
- Soccer: Live heatmaps visualize which team is dominating key areas of the pitch. If a coach sees they're losing the midfield battle, they can make a quick substitution or change formation to reclaim that territory before it leads to a scoring chance.
- Baseball: A dashboard tracking a pitcher’s velocity and spin rate shows a slight dip, signaling fatigue. Seeing this data, the manager can decide to get a relief pitcher warmed up before the starter begins to make costly mistakes.
This immediate feedback loop lets coaches be proactive instead of reactive, changing the entire flow of a game with moves backed by hard data.
Simulating Game Scenarios for Better Prep
Beyond just picking apart past games, modern dashboards can use historical data to simulate future ones. By running thousands of computer simulations, teams can test-drive different game plans and strategies against a virtual model of their next opponent.
This process helps answer crucial strategic questions before the team even leaves the locker room. What's our most effective lineup against this specific team? How should our defense adjust if their star player gets into foul trouble? Running these "what-if" scenarios helps teams prepare for almost anything they might face.
This is how analytics translates directly into points on the scoreboard. It’s all about using data to find and exploit the small advantages that, over the course of a game, add up to make a huge difference. The people who can build and interpret these strategic models are in high demand across every major sports league.
Powering the Business of Sports
While player performance and on-field tactics grab all the headlines, a huge part of the analytics revolution is happening behind the scenes. Modern sports franchises are massive businesses, and the front office is using the exact same data-driven mindset to grow the commercial side of the club. This is where data stops influencing the score and starts boosting the bottom line.
A good dashboard gives the business team the same kind of clarity the coaching staff gets. They're no longer flying blind, relying on old ticket sales reports or just a "gut feeling" about how excited the fans are. Instead, they get a live, detailed picture of the entire business, transforming everything from marketing to financial planning.
Understanding the Modern Fanbase
Today’s fans are more connected than ever, and a sports analytics dashboard is the key to finally understanding them on a deeper level. By pulling data from all over the place, such as ticket scans, social media, and website visits, a marketing team can build a rich profile of its audience. This is about understanding actual behavior and what fans are thinking in real-time.
A dashboard can bring critical business metrics to life, like:
- Ticket Sales Patterns: Which games are hot? What sections are selling out first? How does a price drop affect demand for a Tuesday night game?
- Merchandise Performance: Are the new city-edition jerseys flying off the shelves? Which player's gear is a surprise top-seller? Is it time to re-stock?
- Social Media Sentiment: How are fans reacting right now to a big trade? Are they buzzing about the new stadium food? What's the mood after a tough loss?
A dashboard gives marketing teams a direct line to their fanbase. It allows them to move beyond broad campaigns and create highly targeted promotions that speak directly to specific fan segments, leading to higher engagement and revenue.
When you know what your fans truly want, you can create better experiences that build real, lasting loyalty. The people who can read this data and turn it into smart business plays are incredibly valuable.
Smarter Scouting and Roster Investment
The business side of sports is also neck-deep in player moves. General managers and scouts now lean on dashboards to make smarter, more objective decisions when it comes to building a team. It's the ultimate tool for finding undervalued talent that other teams might have completely missed.
For instance, a dashboard can stack up a college prospect's stats against current pros, helping to project their potential impact. It can also run financial models on different roster scenarios, making sure every contract fits the team's long-term budget. This isn't about replacing scouts' intuition; it's about backing it up with hard numbers to build a winning team without breaking the bank.
The money behind this shift is staggering. The U.S. sports analytics market alone is projected to jump from USD 1.7 billion in 2025 to USD 8.6 billion by 2034. Globally, we could be looking at a USD 31.1 billion market by 2034. This explosive growth is creating a massive demand for people with the right skills, just look at roles like the Sr. Manager, Data Analytics role for the FIFA World Cup.
How to Choose Your First Dashboard
So, your team is finally ready to graduate from spreadsheets and get a real sports analytics dashboard. That's a huge step. But it immediately brings up a big question: where do you even start?
The decision really boils down to two paths. You can either build a custom dashboard from scratch or buy a ready-made solution from an established company.
Each route has its own trade-offs, and the right answer depends entirely on your team's specific goals, your technical know-how, and, of course, your budget. Let's break down what you need to think about to make a smart choice.
Build Versus Buy: The Core Decision
Choosing between building a tool in-house or buying one off the shelf is the first major hurdle. There isn't a single "right" answer here, just the one that best fits your situation.
Building In-House: This path gives you total control. You can design a dashboard perfectly tailored to your team’s unique workflows and analytical needs. Every metric, every chart, every single feature can be built exactly the way you want it.
But that level of control comes at a price. You'll need a skilled crew of data engineers, analysts, and developers to actually build and maintain the system. This can be expensive and take a lot of time, but the end result is a tool that is truly yours.
Buying a Solution: Going with a provider like Catapult, SAP, or Sportradar gets you up and running much, much faster. These companies offer polished, powerful platforms that have been battle-tested by countless pro organizations. You get access to advanced features and solid support without needing a big internal tech team.
The trade-off? A little less flexibility. While many platforms offer decent customization, you’re still playing in the vendor’s sandbox. You also have to factor in ongoing subscription costs.
The decision to build or buy often comes down to this: do you need total control over every detail, or is speed and reliability your top priority? A custom build offers maximum flexibility, while a vendor solution provides a faster, more direct path to advanced analytics.
A Framework for Your Choice
To figure out which path is right for you, you need to get honest about these key areas.
- Total Cost of Ownership: Don’t just look at the upfront price tag. For a custom build, you have to factor in salaries, server costs, and ongoing maintenance. For a vendor, think about subscription fees, setup costs, and any extra charges for more features or support.
- Customization Needs: Be real with yourself about how much tailoring you actually need. Does your team have a super-specific analytical method that no existing platform supports? If so, building might be your only option. If your needs are more standard, an off-the-shelf product will probably do the trick.
- Implementation Speed: How fast do you need to see results? A vendor solution can often be up and running in a few weeks. An in-house build could take many months, or even longer.
- Technical Skills: Do you have the people on staff to build, manage, and fix a complex dashboard? If not, buying a solution with dedicated support is the safer bet. This is a critical point. Having the right talent is everything. If you need to build out your team, you can find qualified pros at www.sportsjobs.online.
Making the right call on your first sports analytics dashboard sets the foundation for your entire data strategy. By weighing these factors carefully, you can pick a solution that fits your budget, matches your goals, and helps your team unlock its full potential.
Frequently Asked Questions
When teams and organizations start digging into their data, a few common questions always pop up about what a sports analytics dashboard actually does and why it's worth it. Getting these things straight is the key to understanding why they've become a non-negotiable tool in modern sports.
Let's tackle some of the most common ones to clear things up.
How Is a Sports Analytics Dashboard Different from a Spreadsheet?
This is a great question and gets right to the heart of it. While you can look at data in both, they're worlds apart in how they work. A spreadsheet, like Excel, is basically a static file. You have to manually punch in the numbers and mess with them in rows and columns. It’s fine for a quick, one-time calculation, but it completely falls apart when you're dealing with big, constantly changing datasets. It just gets slow and clunky.
A dashboard, on the other hand, is a living, breathing system. It plugs directly into your data sources, think player GPS trackers or live video analysis, and updates all the charts and graphs automatically.
Think of a spreadsheet as a single photograph, a snapshot in time. A dashboard is more like a live video feed, giving you real-time, interactive insights as the action unfolds.
It's all about moving from static reports to dynamic decision-making.
What Skills Do I Need to Use a Dashboard?
Good news: you don't need to be a data scientist. Not at all. The whole point of a well-built dashboard is to take all that complex data and make it dead simple for coaches, trainers, and even the athletes themselves to understand. If you can use a computer, you can use a good dashboard.
The dashboard is designed to do all the heavy lifting in the background. The coach’s job is simply to look at the insights and make a smarter call on the field. It’s about empowering the real experts, not turning them into coders.
Now, the people who actually build, customize, and manage these dashboards? That's a different story. Those roles demand a much deeper skill set, including data engineering, data visualization, and a solid grasp of statistics. The demand for these folks is exploding. If that kind of work sounds exciting, it's worth checking out a specialized job board like www.sportsjobs.online to see exactly what skills teams are hiring for right now.
Can Small Teams or Schools Afford a Dashboard?
Absolutely. While the big-league solutions you see on TV can have a hefty price tag, the market has grown a ton. There are now plenty of scalable and much more affordable options that are perfect for smaller colleges, high schools, or even amateur clubs.
Many companies have tiered pricing, so you only pay for what you need. There are even open-source tools out there that can be customized if you have someone with the right tech skills. The trick is to figure out your most critical needs first and find a tool that solves those specific problems. A simple, focused dashboard that everyone uses is way more valuable than a fancy, complex one that just gathers dust.
Hundreds of jobs are waiting for you!
Subscribe to membership and unlock all jobs
Sports Analytics
We scan all major sports and leagues
Updated Daily
New jobs are added every day as companies post them
Refined Search
Use filters like skill, location, etc to narrow results
Alerts
You can get daily alerts in your email for a specific search
Monthly
$6.99
per month
✓ Flexible monthly billing
✓ Unlimited access to all jobs
✓ Advanced filtering tools
✓ Exclusive discount codes
✓ Cancel anytime
BEST VALUE
Yearly
$39
per year • Only $3.25/mo
✓ Save 50% vs monthly
✓ Unlimited access to all jobs
✓ Advanced filtering tools
✓ Exclusive discount codes
✓ Cancel anytime
Lifetime
$59
one-time • forever
✓ Pay once, access forever
✓ Unlimited access to all jobs
✓ Advanced filtering tools
✓ Exclusive discount codes
✓ Best long-term value