Learn Python for Data Science Your Complete Guide
Thinking about learning Python for data science? Good call. Honestly, it's the smartest move you can make right now. Python dominates the data world for a simple reason: it’s relatively easy to pick up, but it’s packed with powerful tools that make complicated analysis feel surprisingly straightforward.
This is your most direct path to analyzing data, building predictive models, and kicking off a career in a field that's absolutely exploding.
Why Python Is Your Key to a Data Science Career
The demand for data science skills is off the charts. We're looking at a projected annual growth rate of 28%, which translates to over 11 million new jobs expected by 2026. This isn't just hype; it's driven by a real-world 65% year-over-year jump in AI adoption by companies.
In this kind of market, knowing Python is like having a golden ticket. Skilled data scientists in the US are pulling in salaries between $120,000 and $180,000 a year. The opportunity is massive.
The Clear Industry Favorite
Let's be real: Python isn't just an option; it's become the standard for data professionals. Its simple, readable syntax is a game-changer. You get to spend your time solving actual problems instead of fighting with confusing code. For beginners, this is a huge win, it means you can get up and running and start producing results much faster.
Just look at how Python stacks up against other languages in the data science community.
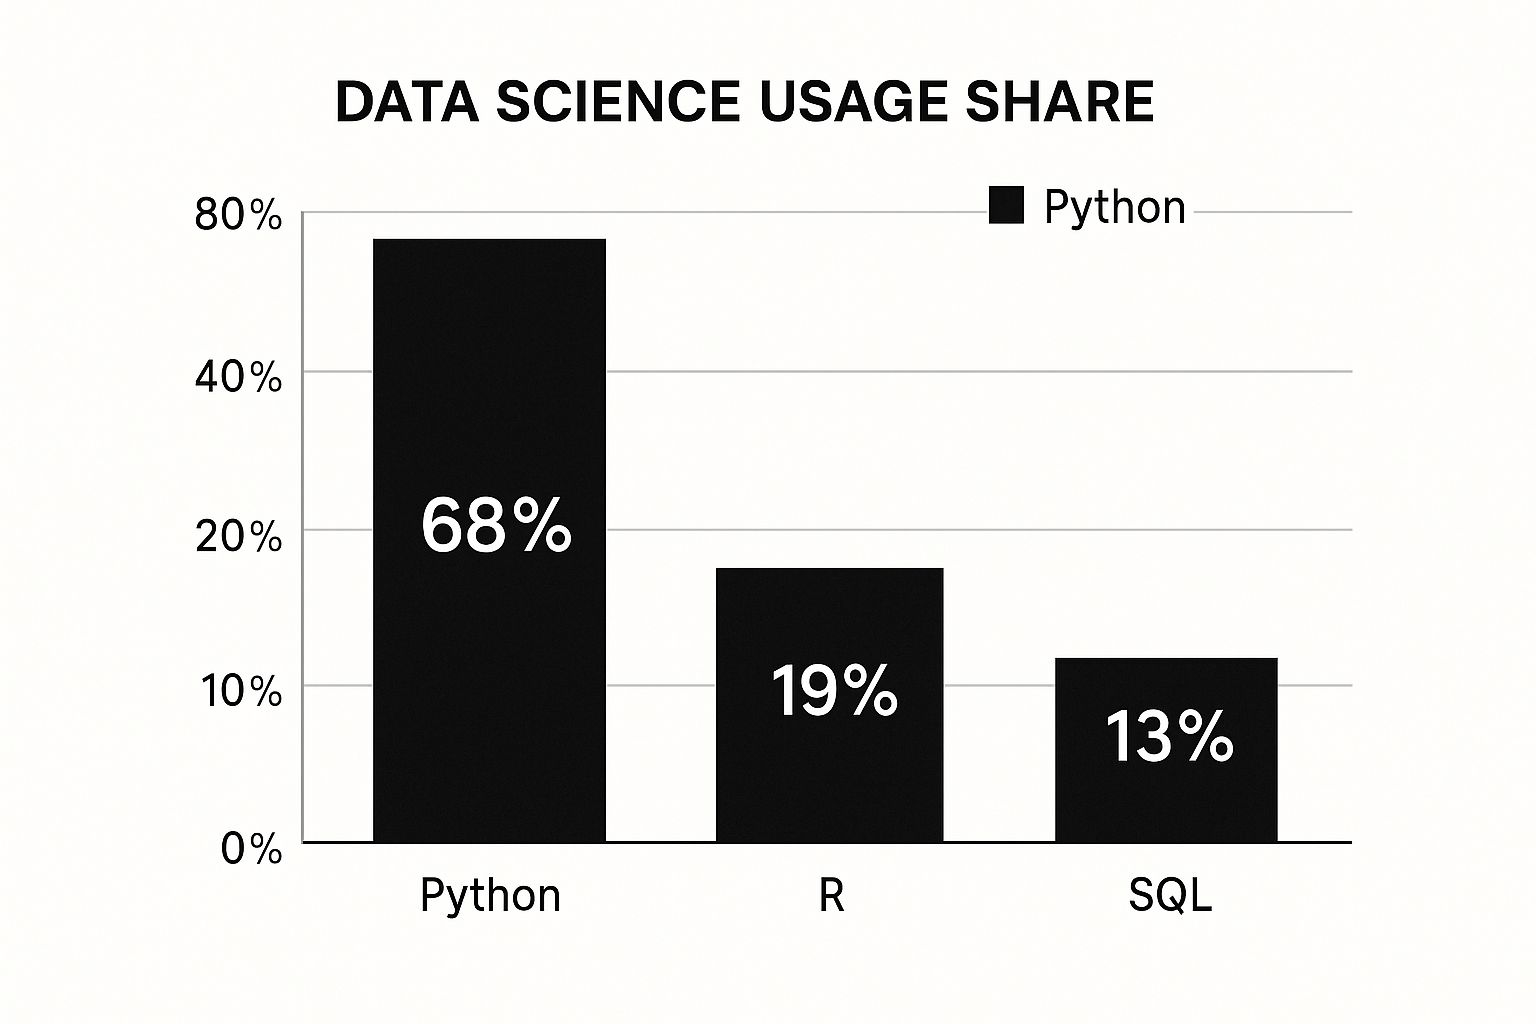
The numbers don't lie. With a 68% usage share, Python is the undisputed leader. This isn't just a popularity contest. This widespread adoption means you'll find more tutorials, a bigger support community to help when you're stuck, and way more job opportunities.
A Powerful Ecosystem for Data Tasks
So, why is Python the top choice? It's all about the libraries. Think of these as pre-built toolkits that handle the heavy lifting for you.
- NumPy and pandas are your workhorses for wrangling and cleaning massive datasets. You'll use them every single day.
- Matplotlib and Seaborn let you create stunning charts and graphs. This is how you tell compelling stories with your data.
- Scikit-learn is pure magic. It gives you the power to build sophisticated machine learning models without needing a Ph.D. in advanced statistics.
Getting comfortable with these libraries is what truly separates a casual coder from a professional data scientist. They are the bedrock of almost every data project you'll ever touch.
Of course, the tools are only part of the equation. To really make an impact and level up your career, you need to have a solid grasp of the core data science fundamentals. A strong foundation makes your Python skills that much more powerful.
Python vs Other Data Science Languages
It helps to see exactly why Python has pulled so far ahead of the pack. Here’s a quick breakdown comparing it to other common languages you might hear about.
| Feature | Python | R | SQL |
|---|---|---|---|
| Primary Use | General-purpose, machine learning, web integration | Statistical analysis, academic research | Database querying and management |
| Learning Curve | Gentle; easy-to-read syntax | Moderate; steeper for non-statisticians | Easy for querying, harder for complex logic |
| Community Support | Massive and diverse; tons of resources | Strong in academia and statistics | Large, but focused purely on databases |
| Job Market | Dominant; highest demand across industries | Niche; strong in research and biotech | Essential, but usually as a secondary skill |
While R is fantastic for deep statistical work and SQL is a must-know for getting data out of databases, Python offers the best all-around package. Its versatility is what makes it the top choice for building a career from the ground up.
Setting Up Your Python Data Science Environment

Before you can start analyzing data and building models, you need to get your workshop ready. Trust me, getting this part right from the beginning saves you from countless headaches down the road and lets you focus on what actually matters, learning.
Our goal is to build a professional-grade Python data science environment right on your computer.
The good news? It's much easier than you think. You don’t need to install Python and then go on a wild goose chase, hunting down every single library one by one. There’s a much smarter way to get everything you need in one clean installation.
Your All-in-One Solution: Anaconda
The best tool for the job, hands down, is Anaconda. Think of it as the ultimate starter kit for data science. It bundles Python with all the essential libraries like NumPy, pandas, and Matplotlib, so you're ready to hit the ground running from day one. There's a reason it's the industry standard, used by millions of developers.
Getting started with Anaconda is pretty straightforward:
- Download the Installer: First, head over to the official Anaconda website and grab the installer for your operating system (Windows, macOS, or Linux).
- Run the Installation: The process is a simple click-through wizard. Just follow the on-screen prompts, it’s generally safe to stick with the default settings.
- Launch Anaconda Navigator: Once it's installed, you can open the Navigator. This is a simple graphical interface that lets you manage all your tools without ever having to touch the command line.
A clean installation is the bedrock of your journey to learn Python for data science. Get this right, and you'll spend less time troubleshooting and more time practicing the skills that will actually land you a job.
If you're aiming for a competitive field like sports analytics, a professional setup is non-negotiable. Top teams and companies expect you to be proficient with these standard tools. If you are looking for a job in the sports industry, you can browse job openings at www.sportsjobs.online.
Launching Your First Jupyter Notebook
From the Anaconda Navigator, you'll see an option to launch Jupyter Notebook. This is where the magic happens; it will be your primary workspace.
Jupyter is an interactive tool that runs right in your web browser. It’s brilliant because it lets you write and execute code in small, manageable chunks, see the output immediately, and mix your code with notes and visualizations.
This interactive format is absolutely perfect for exploring data. You can test ideas on the fly, document your thought process as you go, and create reports that are easy for others to follow. Getting comfortable with Jupyter is a fundamental step toward becoming a productive data scientist.
Now that your environment is all set up, you’re ready to dive into the core concepts of Python.
Alright, once you've got your setup handled, it's time to actually write some code.
The best part about picking up Python for data analysis is that you don't need to learn every single corner of the language. Honestly, you can get incredibly far by just focusing on a handful of core concepts you’ll use day in and day out. This lets you get your hands dirty and start producing results way faster.
Think of it like learning to cook. You don't need to memorize every recipe ever written. You just need to nail the fundamentals, how to chop, how to sauté, how to season. It’s the exact same idea here. We’ll focus on the absolute must-knows that form the bedrock of almost any data task you'll face.
Storing and Organizing Your Data
At its core, data analysis is all about manipulating information. In Python, that journey starts with variables and the basic data types.
A variable is just a name you assign to a piece of data, like player_salary or team_wins. These variables hold different data types: integers for whole numbers, strings for text, and booleans for simple true/false values.
From there, we need ways to group this information together. The two workhorses you'll constantly rely on are lists and dictionaries.
- Lists: These are your go-to for ordered collections of items. You might use a list to track the goals scored in the last five games:
goals_scored = [2, 1, 3, 0, 2]. - Dictionaries: Perfect for storing related bits of info as key-value pairs. Think of a player's stat sheet:
player_stats = {'name': 'Jane Doe', 'position': 'Forward', 'goals': 21}.
Getting comfortable with lists and dictionaries is non-negotiable. They are your primary tools for structuring raw data before you even think about running a complex analysis.
Automating Tasks with Control Flow
Writing code one line at a time is fine for small tasks, but the real magic happens when you make the computer handle the repetitive work for you. This is where control flow comes into play.
With loops and conditional statements, you can automate tasks that would take you hours to do by hand.
For instance, a for loop can zip through your goals_scored list to calculate the total in a blink. An if statement can check if a player's goal count is high enough to be labeled a "top scorer."
This is the point where you go from just issuing commands to building intelligent scripts. It’s how you’ll clean up a dataset with thousands of rows or test out different ideas without breaking a sweat.
Efficiency like this is a huge deal in many data jobs, especially in the fast-moving sports world. If you want to see how these skills pop up in real job descriptions, just browse the data analyst roles on a platform like www.sportsjobs.online.
Writing Reusable Code with Functions
As your projects get more ambitious, you'll catch yourself writing the same chunks of code again and again. This can be boring and it's a recipe for mistakes. The solution? Functions.
A function is simply a reusable block of code that does one specific thing.
You could write one function to calculate a team's winning percentage, then call it for every single team in your dataset. This makes your code cleaner, more organized, and way easier to fix when something goes wrong. Mastering simple functions is a huge leap from being a beginner to being genuinely productive with Python.
The Essential Python Libraries for Data Science

Once you've got a handle on the Python basics, you’ll quickly see where its real power for data science lies: its massive ecosystem of libraries. These are basically specialized toolkits that do all the heavy lifting, letting you perform incredibly complex tasks with just a few lines of code.
Getting comfortable with these core libraries is a non-negotiable part of your journey to learn Python for data science. These are the tools of the trade, the things you'll use every single day to wrestle raw data into submission and pull out real insights.
The industry has overwhelmingly picked Python for these jobs. In fact, its dominance is staggering, over 90% of data professionals use it as their main language. A 2022 survey highlighted this gap, showing Python way ahead of other tools like SQL (53%) and R (38%). This isn't just a trend; it's the standard. A 2023 analysis of job postings found that 78% of data scientist roles flat-out required Python skills, and that’s almost entirely because of the libraries we're about to cover.
NumPy and pandas for Data Handling
Your first and most important stop is learning NumPy and pandas. These two libraries are the absolute bedrock of data manipulation in Python. You can't get far without them.
NumPy, short for Numerical Python, is all about arrays. It provides a ridiculously fast and efficient way to work with large sets of numbers. Anytime you need to do heavy-duty math on a massive list of values, NumPy is your go-to.
Then you have pandas, which is built right on top of NumPy. It gives us the DataFrame, a powerful, two-dimensional structure that looks a lot like a spreadsheet. It's perfect for handling mixed data types. With pandas, you can easily:
- Load data from all sorts of files, like CSVs or Excel sheets.
- Clean up messy data by filling in missing values or fixing typos.
- Filter, sort, group, and reshape your data to get it ready for analysis.
I can't stress this enough: a solid grip on these two is essential. If you’re eyeing a competitive role, like a data scientist role in the sports industry, you'll find NumPy and pandas listed as must-have skills on virtually every single job description.
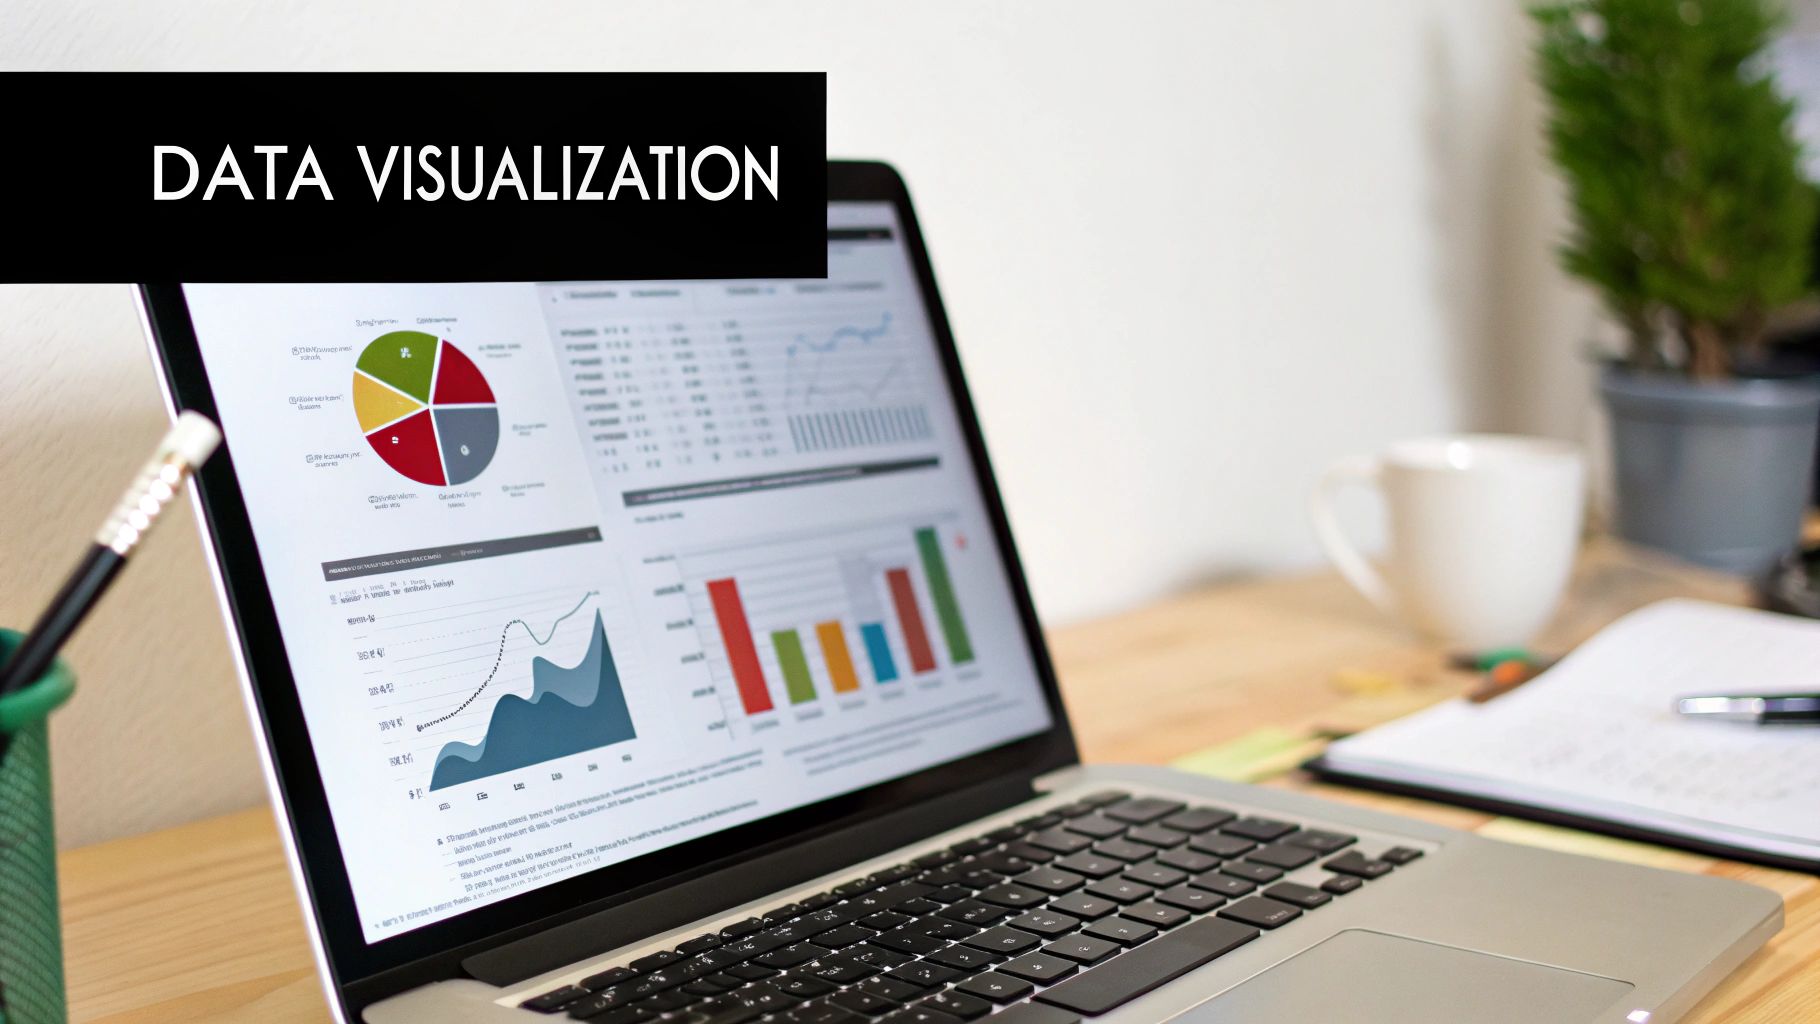
Matplotlib and Seaborn for Visualization
Data is pretty useless if you can't show people what it means. This is where Matplotlib and Seaborn come into play. These are your tools for creating sharp, insightful charts and graphs.
Matplotlib is the old guard of plotting libraries, giving you granular control over every single pixel of your visualizations. Seaborn, which is built on Matplotlib, offers a simpler way to create more modern, statistically-focused plots like heatmaps and violin plots.
Being able to visualize data is how you tell a story. It’s how you take a table of numbers and turn it into a clear, persuasive argument that anyone can understand.
Scikit-learn for Machine Learning
When you're ready to graduate from analyzing the past to predicting the future, you'll turn to scikit-learn. This is the undisputed king of machine learning libraries in Python, and it makes building predictive models surprisingly straightforward.
With scikit-learn, you can jump into classification, regression, and clustering algorithms without needing a Ph.D. in statistics. For instance, you could whip up a model to predict which customers are likely to churn or to forecast next quarter's sales, all with just a handful of commands.
This whole ecosystem of powerful, interconnected libraries is exactly why Python reigns supreme in data science. To get a better sense of the broader toolkit used by professionals, it's worth checking out the 10 best open-source libraries for AI/ML engineers.
Building Your First Data Science Project
 Theory is one thing, but rolling up your sleeves and building a project from scratch is where the real learning happens. This is the moment you prove to yourself, and to future employers, that you can actually transform raw data into meaningful insights. Honestly, finishing that first project is a huge milestone on your journey to mastering Python for data science.
The secret to a successful first project? Pick a topic you're genuinely curious about. Forget the standard, boring datasets. Find something that grabs you, whether it’s movie ratings, local housing prices, or player performance stats. When you hit those inevitable roadblocks, a dataset you actually care about will keep you pushing forward.
Defining the Problem and Gathering Data
Every great data project kicks off with a clear question. Before you even think about the numbers, you need to know what you’re trying to figure out. Are you trying to predict house prices based on features like location and size? Or maybe you want to explore the link between a movie's budget and its audience score.
Once you’ve got your question, it's time to hunt for data. For a first-timer, Kaggle is a goldmine of clean, ready-to-use datasets. As you get more comfortable, you’ll probably want to gather your own data. To do that effectively, you can explore various powerful web scraping tools that help you pull the specific information you need for your projects.
Cleaning and Exploring Your Dataset
This is where your pandas skills really get to shine. Let's be real: real-world data is almost never perfect. You’ll be dealing with missing values, correcting weird inconsistencies, and wrestling the data into a format that’s ready for analysis. Don't be surprised if this step takes up a huge chunk of your project time. It's normal.
With your data finally clean, you can dive into Exploratory Data Analysis (EDA). This is the fun part where you start hunting for patterns and stories hidden in the numbers. Use Matplotlib and Seaborn to fire up some histograms, scatter plots, and other visualizations. The whole point is to understand your data on a deeper level and start forming some educated guesses.
A project portfolio is your single most valuable asset when you're on the job hunt. Trust me, one single, well-documented project that shows your end-to-end skills is far more impressive than a dozen half-finished tutorials.
Python's dominance in data science isn't just hype; it's backed by clear industry trends. Between 2020 and 2025, its incredible library support cemented its place as the top language for data scientists in both finance and healthcare. SQL remained crucial for database work, while R settled into more of a niche role, primarily in academic research.
Building and Sharing Your Model
Now it's time to bring in scikit-learn. Based on the question you started with, you'll pick a machine learning model. If you're predicting a number (like a price), a regression model is a great starting point. If you're trying to classify something (like whether an email is spam), you’ll look at classification models.
Once you’ve built your model, the final, crucial step is to communicate your findings. You need to explain the problem you tackled, the steps you took, and, most importantly, what you discovered. This process of building and sharing is exactly what data professionals do every day. Specialized fields are always on the lookout for people with these proven skills, which is why you see opportunities like this Data Engineer position on our job board.
Common Questions About Learning Python for Data Science
As you start your journey into Python for data science, you're bound to have some questions. It's totally normal. Getting straight, honest answers helps you set the right expectations and, more importantly, keeps you from getting discouraged.
Let's tackle some of the most common questions I hear from people just starting out.
How Long Does It Really Take to Become Job-Ready?
This is always the first question, and the real answer is: it depends.
If you can consistently put in about 10-15 hours a week, you could get pretty comfortable with Python and its main data science libraries in about three to six months. That’s enough time to build some small projects and really get a feel for the day-to-day workflow of a data scientist.
But becoming truly job-ready? For the kind of roles you really want, you're probably looking at closer to a year. Why? Because that extra time is what you need to build a standout project portfolio, the kind that proves to employers you can actually do the work.
Do I Need to Be a Math Genius?
Definitely not. You don’t need a Ph.D. in advanced mathematics to succeed here.
A solid grasp of basic statistics and linear algebra is certainly useful, but you won't be doing complex proofs by hand. Amazing libraries like scikit-learn do all the heavy lifting for you.
What’s far more important is understanding the concepts. You need to know what a regression model is actually doing, or why you'd pick a classification algorithm for a specific problem. It's much more about applying logic and solving problems than it is about being a human calculator.
How Do I Build a Portfolio That Stands Out?
Your portfolio is your single most important asset. A couple of unique, well-explained, end-to-end projects will beat a dozen half-finished tutorials every single time.
Here's how to make your portfolio impressive:
- Find Unique Datasets: Ditch the overused, standard datasets. Find data that actually excites you. Maybe it's sports stats, local real estate trends, or movie ratings. Your passion will shine through.
- Tell a Clear Story: Don't just dump code on a GitHub page. Explain the problem you wanted to solve, walk through your process, and highlight what you discovered. Communication is a massive part of the job.
- Focus on the "So What?": Frame your results around business impact. Instead of "my model achieved 92% accuracy," try something like, "this model can identify high-value customers with 92% accuracy, potentially increasing marketing ROI."
Key Takeaway: A great portfolio shows more than just code. It shows curiosity, problem-solving, and the ability to communicate results. It's what gets your foot in the door.
At the end of the day, your portfolio is what will make a hiring manager notice you, especially for niche roles. For example, a sharp, well-documented sports analytics project would be a massive advantage if you were applying for a Data Scientist intelligence position in the sports world.
At Sportsjobs Online, we connect talented data professionals with exciting opportunities in the world of sports. If you're ready to turn your passion for data and sports into a career, check out the latest openings on our job board. Find your next opportunity at https://www.sportsjobs.online.
Hundreds of jobs are waiting for you!
Subscribe to membership and unlock all jobs
Sports Analytics
We scan all major sports and leagues
Updated Daily
New jobs are added every day as companies post them
Refined Search
Use filters like skill, location, etc to narrow results
Alerts
You can get daily alerts in your email for a specific search
Monthly
$6.99
per month
✓ Flexible monthly billing
✓ Unlimited access to all jobs
✓ Advanced filtering tools
✓ Exclusive discount codes
✓ Cancel anytime
BEST VALUE
Yearly
$39
per year • Only $3.25/mo
✓ Save 50% vs monthly
✓ Unlimited access to all jobs
✓ Advanced filtering tools
✓ Exclusive discount codes
✓ Cancel anytime
Lifetime
$59
one-time • forever
✓ Pay once, access forever
✓ Unlimited access to all jobs
✓ Advanced filtering tools
✓ Exclusive discount codes
✓ Best long-term value